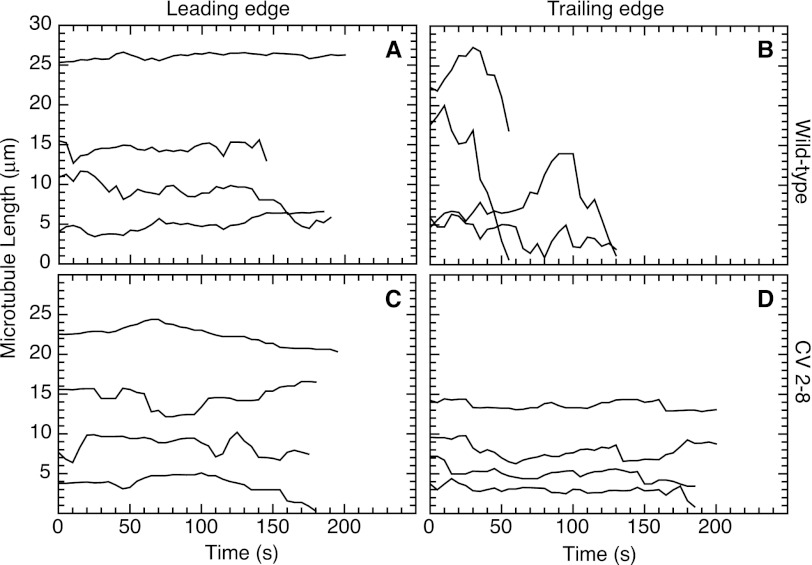
FIGURE 5.
Microtubule dynamics at the leading (A and C) and trailing edges (B and D) of migrating cells. Wild-type CHO cells (A and B) and mutant CV 2-8 (C and D) were transfected with EGFP-MAP4 and grown to near confluence. A scratch was introduced into the monolayer, and the lengths of individual microtubules in cells moving into the wound were measured every 5 s. The lengths were plotted against time to generate life history plots. Note that lengths were measured relative to a fixed internal reference point and are not meant to indicate the actual total length of a microtubule. Also, the position on the y axis is arbitrary, and a decrease to zero does not mean that the microtubule has completely disappeared. Some observation times were shorter than others because a microtubule depolymerized past the reference point or went out of focus. Each line represents a single microtubule.

