FIGURE 2.
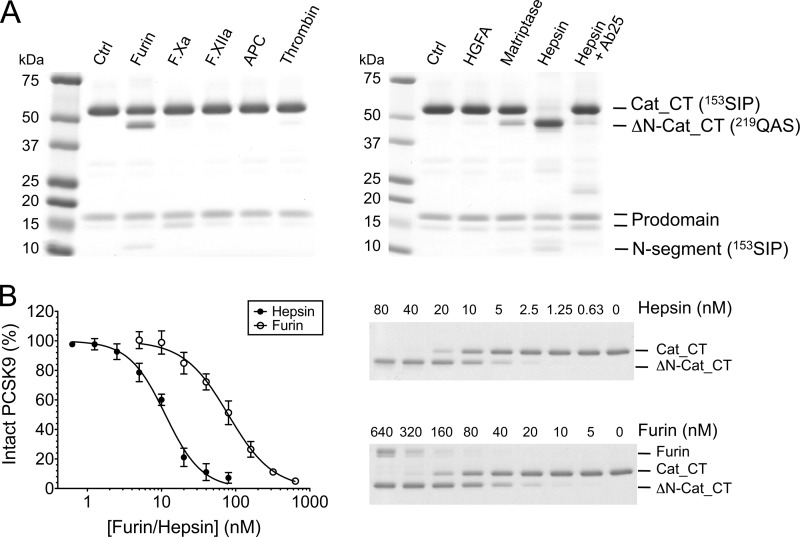
PCSK9 cleavage by serine proteases furin and hepsin. A, PCSK9 (1.9 μm) was incubated with 40 nm of various serine proteases for 6 h at room temperature, and the reaction products were analyzed by SDS-PAGE (nonreducing conditions) followed by gel staining with SimplyBlue SafeStain. The individual bands are indicated according to the nomenclature in Fig. 1A, and the determined N-terminal sequences are in parentheses. The far right lane shows hepsin that was pretreated with the inhibitory anti-hepsin antibody Ab25 before incubation with PCSK9. Ctrl, untreated PCSK9; APC, activated protein C; HGFA, hepatocyte growth factor activator. B, comparison of proteolytic activities of furin and hepsin toward PCSK9. PCSK9 (1.9 μm) was incubated for 6 h with increasing protease concentrations (soluble hepsin and soluble furin) and analyzed by SDS-PAGE (right panel). Disappearance of the ∼60-kDa PCSK9 band (Cat_CT domain) was quantified and plotted against protease concentration (left panel). The calculated concentrations for 50% PCSK9 cleavage were 11.6 ± 0.6 nm for hepsin and 80.7 ± 29.1 nm for furin (average ± S.D. of three experiments).

