FIGURE 5.
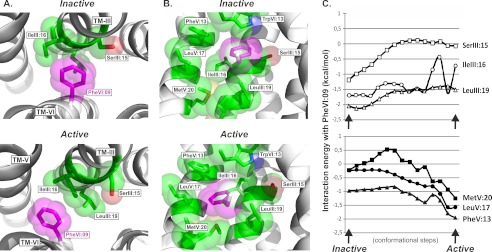
Interaction mode and energy between PheVI:09 and the hydrophobic residues in TM-III and TM-V in the B2AR. A, the interaction mode of PheVI:09 (purple) with SerIII:15, IleIII:16, and LeuIII:19 (green) in TM-III viewed from the extracellular side of the inactive (PDB entry 2RH1) and active (PDB entry 3P0G) structures of the B2AR shown in the left and right panels, respectively. B, side view (toward TM-III) of the interaction of PheVI:09 (purple) with the surrounding residues TrpVI:13, SerIII:15, IleIII:16, LeuIII:19, PheV:13, LeuV:17, and MetV:20 (green) in the inactive and active structure of B2AR. C, interaction energy landscape between PheVI:09 and the surrounding residues in TM-III (SerIII:15, IleIII:16, and LeuIII:19; top graph) and in TM-V (MetV:20, LeuV:17, and PheV:13; bottom graph), calculated in 15 conformational steps during “normal mode” simulation of the transition from the inactive (PDB entry 2RH1) to the active structure (PDB entry 3P0G).

