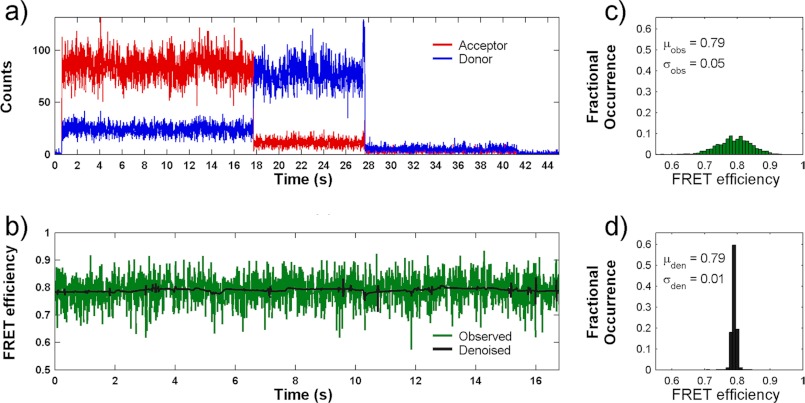
FIGURE 2.
a, representative smFRET trace measured from a single agonist-binding domain of GluA2 subunit in complex with chlorowillardiine showing the raw trajectory for donor (blue) and acceptor (red) photons as a function of time. b, the resulting calculated FRET trajectory (green) and its denoised counterpart (black). c and d, histograms of calculated smFRET values from the raw data (c) and following denoising (d).

