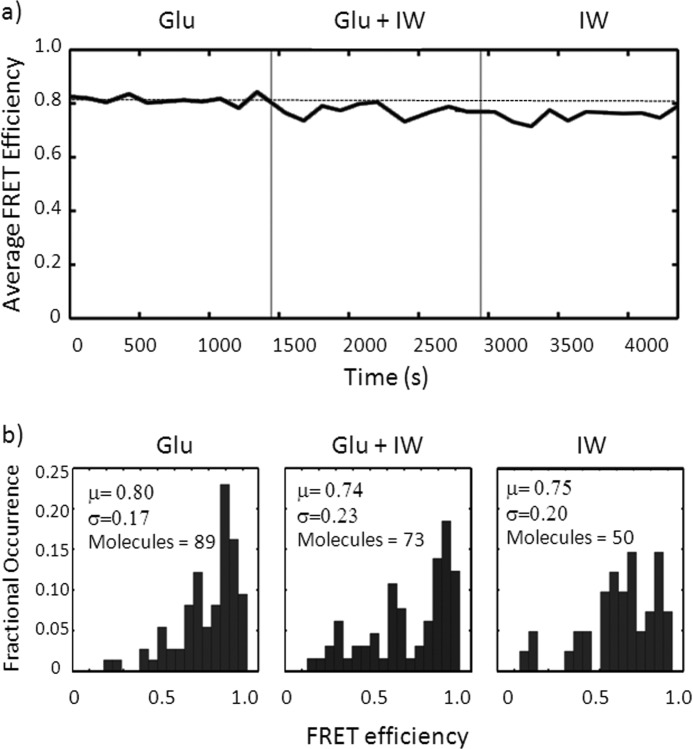
FIGURE 4.
a, plot of average single-molecule FRET efficiency over time during a wash from glutamate to glutamate plus iodowillardiine to iodowillardiine alone. Note the progressive decrease in FRET efficiency as glutamate is displaced by iodowillardiine (IW). b, single-molecule histograms from the experiment in a.

