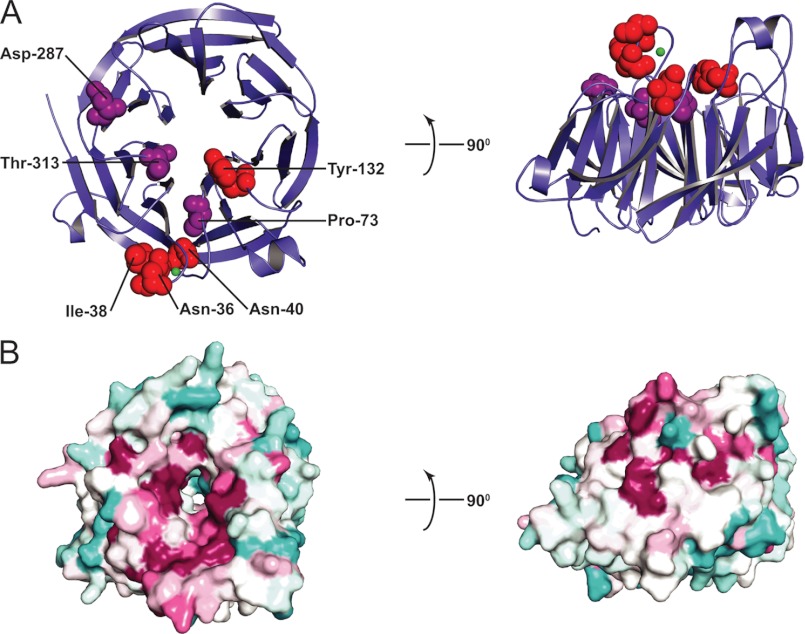
FIGURE 1.
X-ray structure of Sec12. A, ribbon representation of the cytosolic domain of Sec12 (residues 1–354). Residues mutated in this work are shown in a space-filling representation and are colored to reflect the impact of the mutation on GEF activity in vitro, with red signifying <25% of wild-type specific exchange activity and purple signifying milder defects. The impact of N40A, P73L, and T313A mutations on GEF activity were described previously by Futai et al. (13). B, surface representation of the Sec12 structure, with sequence conservation represented in colors ranging from burgundy (most highly conserved) to turquoise (least highly conserved). These images were based on ConSurf analysis (36). The sequence alignment used to generate conservation scores contained primarily yeast Sec12 sequences, obtained by selecting only those sequences sharing at least 15% sequence identity with S. cerevisiae Sec12, residues 1–354.

