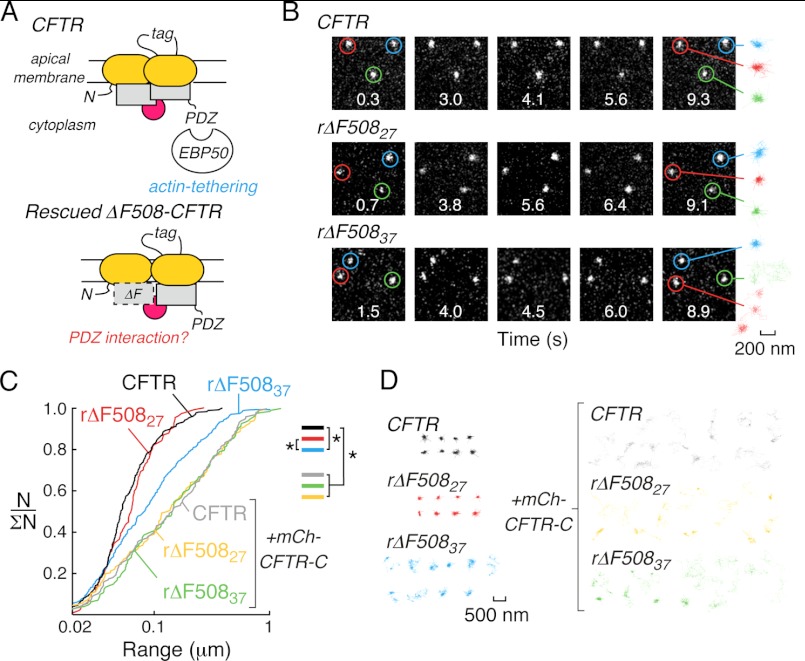
FIGURE 1.
Single-particle tracking of wild-type and low-temperature rescued (r)ΔF508CFTR in HeLa cells. A, C-terminal PDZ interactions tether wtCFTR to actin (top) but their role in rΔF508CFTR plasma membrane stability is unknown (bottom). B, individual frames from SPT image sequences acquired at 30 fps for Qdot-labeled wtCFTR (top), rΔF508CFTR immediately after low temperature correction (rΔF50827, middle) and rΔF508CFTR after low temperature correction and subsequent incubation at 37 °C for 2 h (rΔF50837, bottom). Image acquisition time is given in each frame and highlighted exemplar trajectories are shown for each condition (right, 200 nm scale bar refers to all trajectories). Images are 6.4 × 6.4 μm. C, cumulative distribution plots for wtCFTR (black), rΔF50827 (red), and rΔF50837 (blue) under control conditions, and for wtCFTR (gray), rΔF50827 (orange), and rΔF50837 (green) when expressed with high levels of the CFTR C-terminal region (fused to mCherry, mCh-CFTR-C), which results in mobilization of CFTR. Statistically significant differences in populations are shown (*, p < 0.001). N/ΣN is the normalized cumulative probability distribution where 1 represents the complete population of SPT data. SPT data were derived from 110–316 trajectories. D, color-coded SPT trajectories for each condition shown in Fig. 1C (500 nm scale bar refers to all trajectories).

