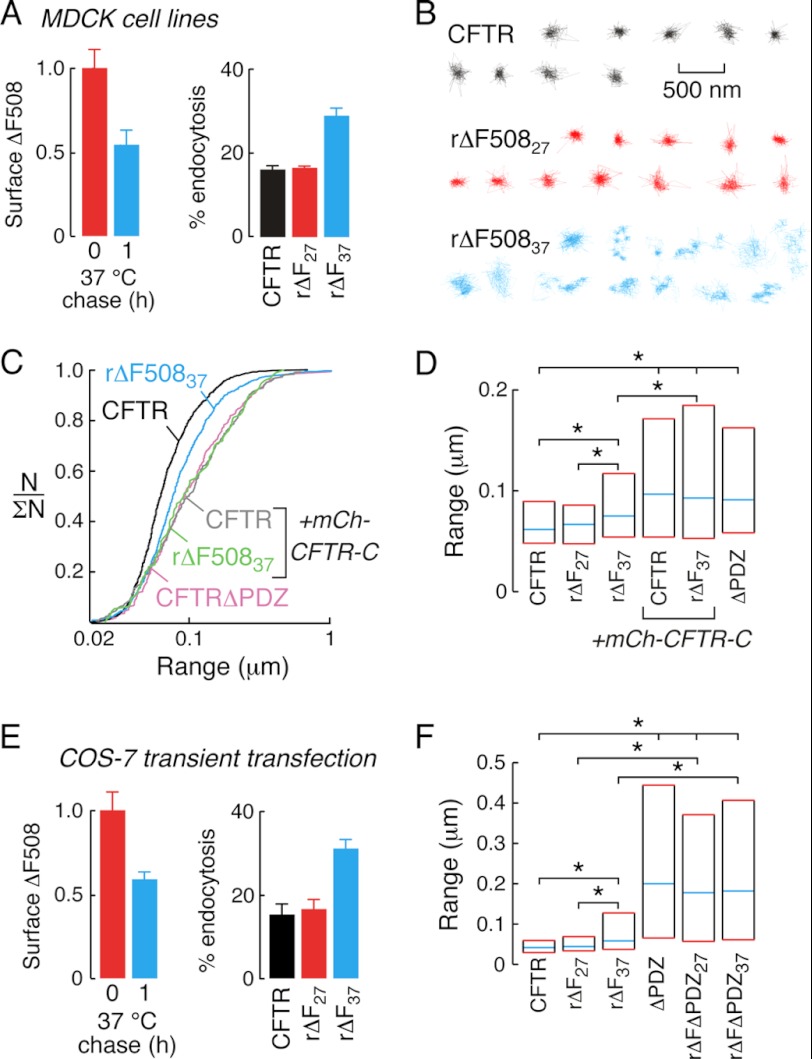
FIGURE 2.
Increased diffusion of rΔF508CFTR in MDCK cell lines and transiently transfected COS-7 cells. A, low temperature corrected ΔF508CFTR surface density (left) and endocytic rates (right) in MDCK cell lines immediately after rescue (red) and after 1 h 37 °C incubation (blue). B, example trajectories of wtCFTR (black), rΔF50827, (red), and rΔF50837, (blue) diffusion in MDCK cell lines. C, cumulative distribution curves for MDCK cell lines expressing wtCFTR (black), rΔF50837 (blue), or CFTRΔPDZ (pink) and co-expressing mCh-CFTR-C with wtCFTR (gray) or rΔF50837, (green). D, summary graph representing median (blue lines) and interquartile (red lines) range values for the diffusion of wtCFTR, rΔF508CFTR and CFTRΔPDZ-expressing MDCK cell lines. As indicated, mCh-CFTR-C was also expressed (bars 4 and 5). E, surface levels (left) and endocytic rates (right) of low temperature corrected 3FLAG-tagged ΔF508CFTR in transiently transfected COS-7 cells immediately after rescue (red) and after 37 °C incubation (blue). F, summary graphs of diffusive range for 3FLAG-tagged wtCFTR, ΔF508CFTR, CFTRΔPDZ, and ΔF508CFTRΔPDZ expressing COS-7 cells. In panels D and F, statistically significant differences in populations are shown (*, p < 0.001). SPT data for MDCK cells was derived from 113–788 trajectories and for COS-7 cells from 140–252 trajectories. Data for CFTR surface density and endocytic rates are mean ± S.E. for 3–8 independent experiments.

