FIGURE 3.
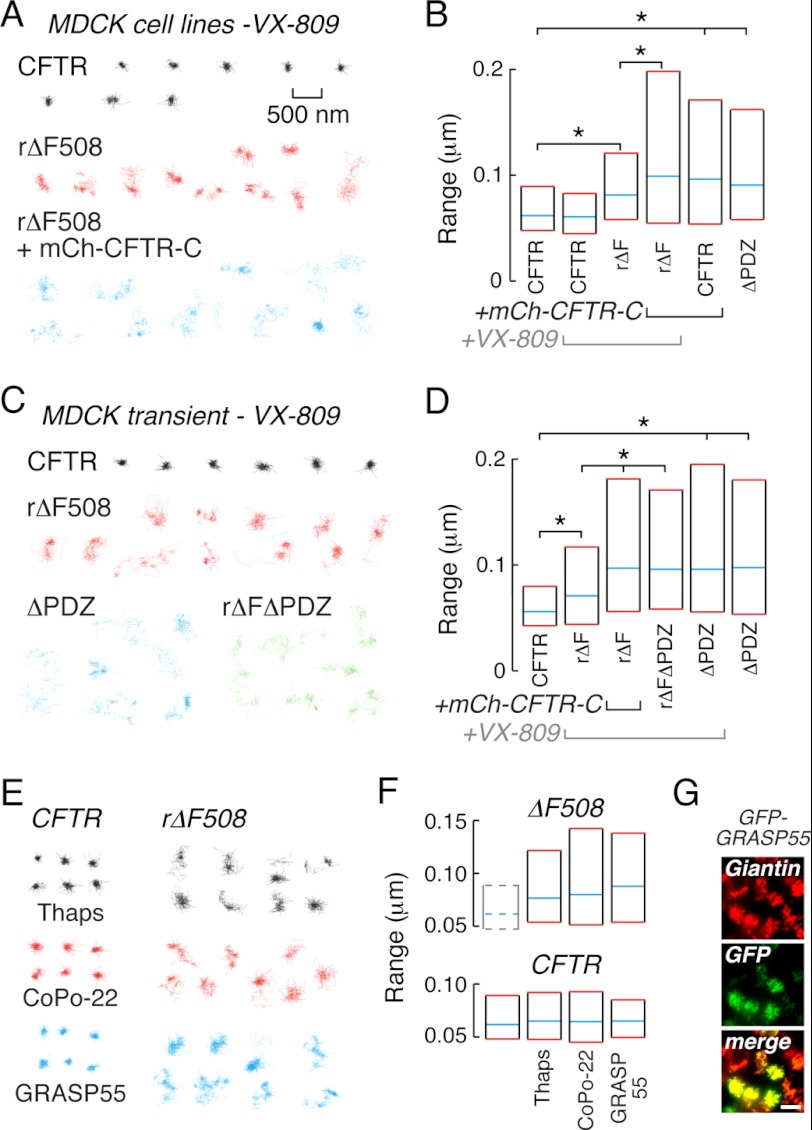
ΔF508CFTR diffusion is increased by different correction mechanisms. A, example trajectories from MDCK cell lines for wtCFTR (black) and ΔF508CFTR rescued by VX-809 treatment in the absence (red) and presence (blue) of mCh-CFTR-C. B, summary graph for wtCFTR, rΔF508CFTR and CFTRΔPDZ diffusion in VX-809-treated and control MDCK cell lines. C, example trajectories for MDCK cells transiently expressing 3FLAG-tagged wtCFTR (black), ΔF508CFTR rescued by VX-809 (red), CFTRΔPDZ (blue), and ΔF508CFTRΔPDZ rescued by VX-809 (green). D, summary graph for CFTR diffusion in VX-809-treated MDCK transiently transfected with 3FLAG-tagged CFTR constructs. E, example trajectories from MDCK cell lines stably expressing wtCFTR (left) and ΔF508CFTR (right) treated with thapsigargin (black) or CoPo-22 (red) or transiently expressing GFP-GRASP55 (blue). F, graphs for ΔF508CFTR (top) and wtCFTR (bottom) diffusion in MDCK cell lines treated with thapsigargin or CoPo-22 or transiently expressing GFP-GRASP55. For reference, median and interquartile values for wtCFTR diffusive range are shown by dashed lines (bar 1, top). G, GFP-GRASP55 is Golgi-localized by immunocytochemical analysis (scale bar, 10 μm). Scale bar in A (500 nm) refers to all trajectories. In panels B and D, statistically significant differences in populations are shown (*, p < 0.001). SPT data for MDCK cell lines was derived from 140–788 trajectories and for transiently transfected MDCK cells from 131–298 trajectories.

