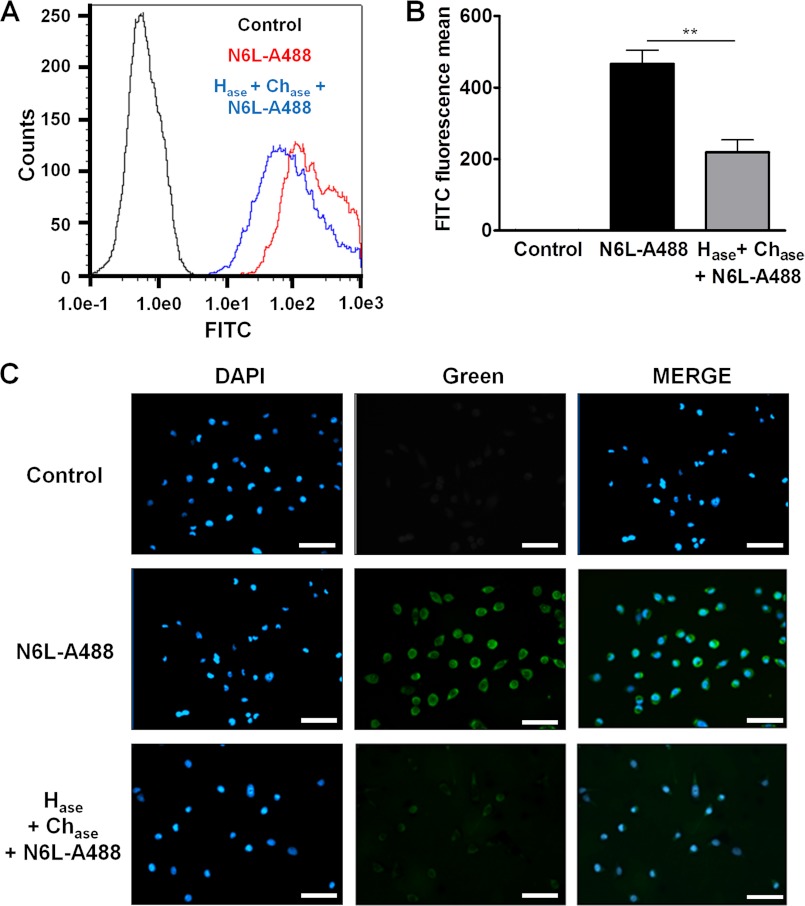
FIGURE 4.
N6L binding to sulfated GAGs on MDA-MB-435 cells. A, fluorescence of nonlabeled MDA-MB-435 cells (Control, black curve), labeled with 0.5 μm N6L-A488for 30 min at 37 °C (red curve) or pretreated with 0.1 unit/ml heparitinase I, II, III (Hase) and 0.1 unit/ml of chondroitinase A, B, C (Chase) for 1 h at 37 °C before labeling with 0.5 μm N6L-A488 for 30 min at 37 °C (Hase + Chase + N6L-A488, blue curve). Fluorescence was analyzed by FACS. B, representation of fluorescence means analyzed in A. Error bars, ± S.E. (n = 3). **, p < 0.01. C, immunofluorescence on nonlabeled MDA-MB-435 cells (Control), labeled with 0.5 μm N6L-A488 for 30 min at 37 °C (N6L-A488) or pretreated with 0.1 unit/ml heparitinase I, II, III/chondroitinase A, B, C for 1 h at 37 °C before being labeled with 0.5 μm N6L-A488 for 30 min (Hase + Chase + N6L-A488). Scale bars, 50 μm.

