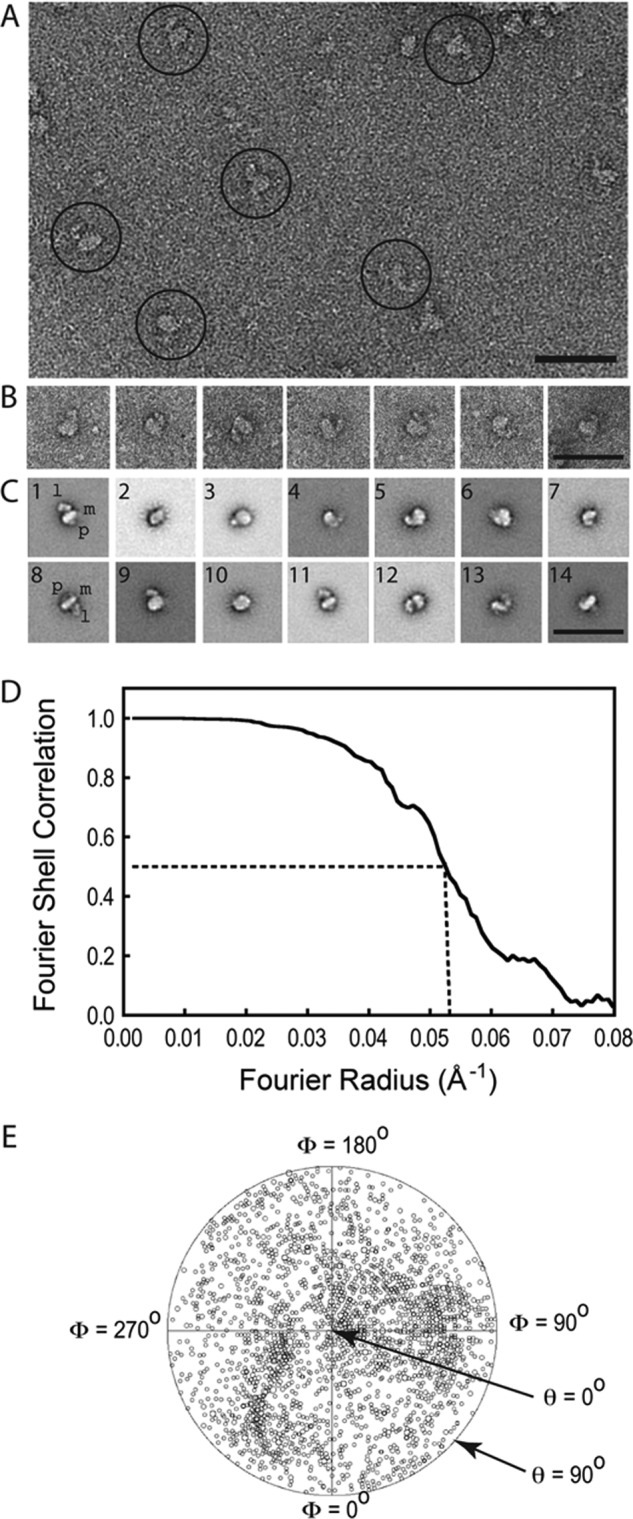
FIGURE 3.

TEM and image processing of the purified DHPR complexes. A, raw electron micrograph displaying a homogeneous distribution of L-type channels. The more representative images are highlighted with circles. B, windowed DHPR particles showing a main body with an appendage. C, gallery of the 2D averages of DHPR after several rounds of classification and multireference alignment. The main body (m), hook- or leg- shaped feature (l), and the small protuberance (p) are indicated in averages 1 and 8. Scale bars for A–C = 50 nm. D, Fourier shell correlation curve indicating a resolution of 19.10 Å according to the 0.5 cutoff criterion. E, plot of the angular distribution of the particles used in the final 3D reconstruction showing a uniform distribution of Euler angular orientations of the DHPR. The size of the small circles represents the number of particles in that orientation, and the center of the circular plot corresponds to a θ angle of 0°.
