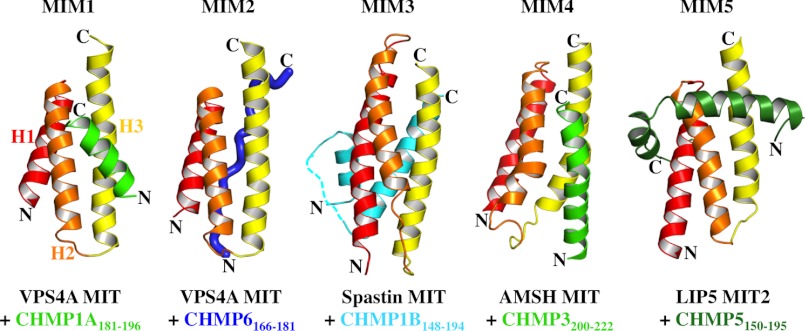
FIGURE 11.
Comparison of the different MIM-MIT complexes. Shown are structures of the following complexes: human VPS4A MIT-CHMP1A(181–199) (Protein Data Bank code 2JQ9), human VPS4A MIT-CHMP6(166–181) (code 2K3W), human spastin MIT-CHMP1B(148–194) (code 3EAB), human AMSH MIT-CHMP3(200–222) (code 2XZE), LIP5 MIT2-CHMP5(155–189) (code 2LXM). In each case, MIT helices 1–3 are shown in red, orange, and yellow, respectively.

