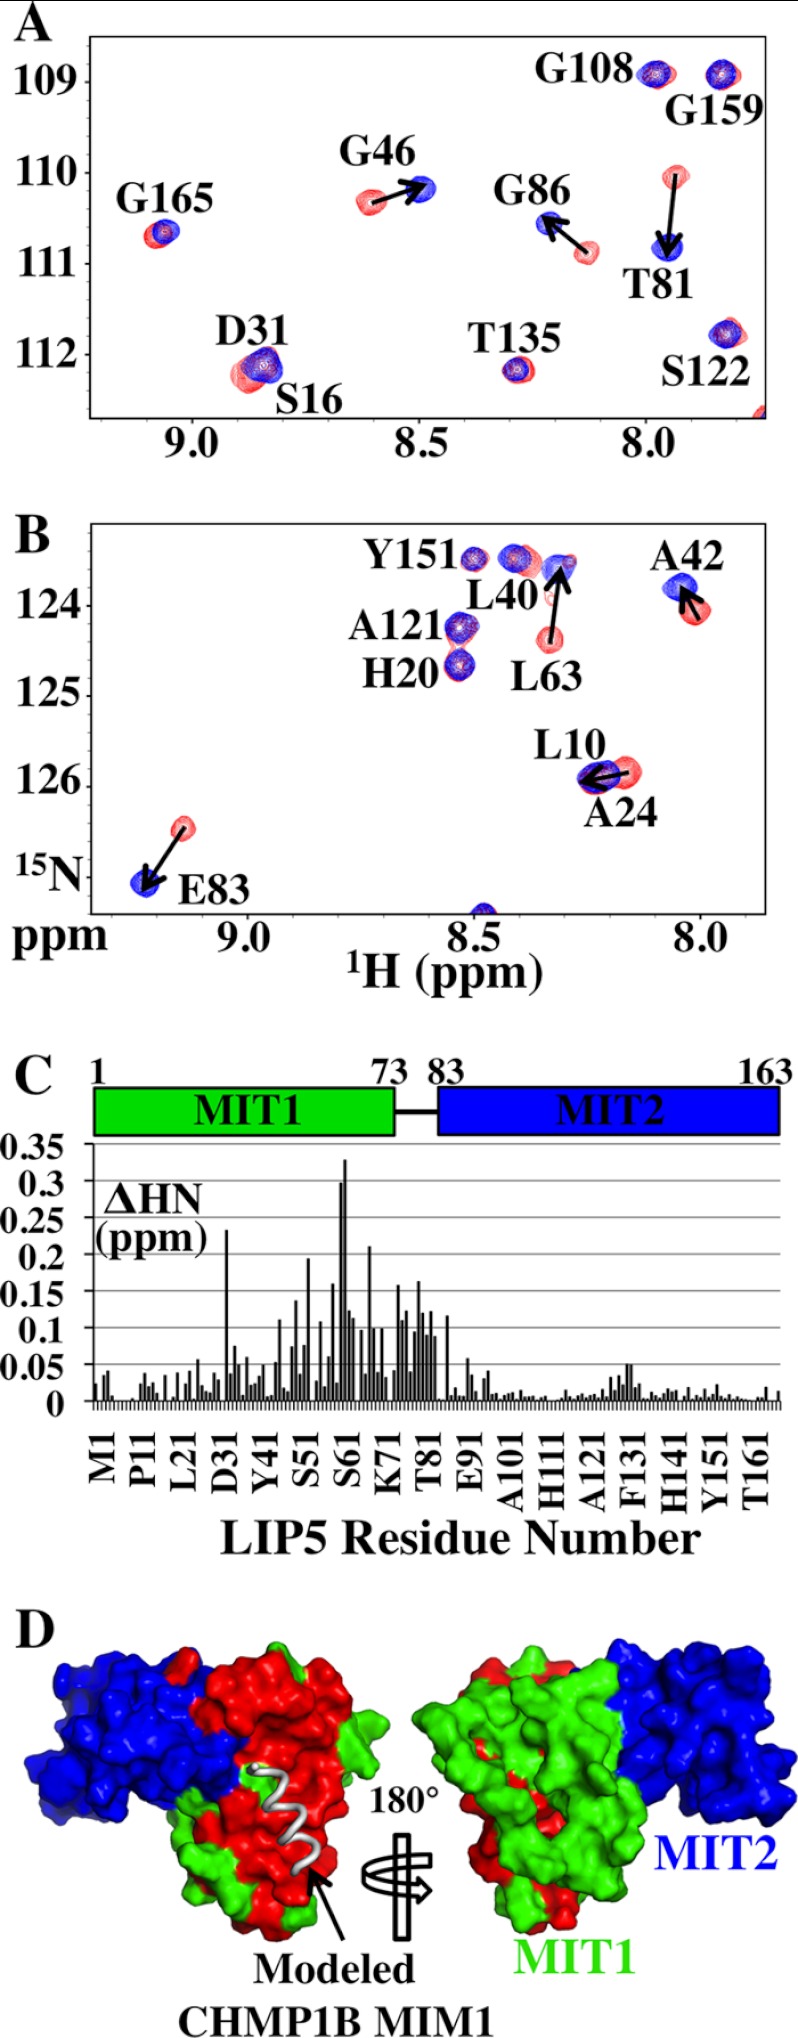
FIGURE 4.
Chemical shift mapping of the CHMP1B-binding site on LIP5(MIT)2. A and B show two different regions of the overlaid 1H-15N HSQC spectra of 15N-labeled LIP5(MIT)2 either free (red) or in complex with CHMP1B(181–199) (blue; 1:2 ratio of LIP5(MIT)2 to CHMP1B(181–199), >99.8% bound). Amide resonances are labeled with their amino acid assignments. The magnitude of chemical shift changes upon CHMP1B(181–199) binding was calculated using the expression ΔHN = (ΔH2 + (ΔN/6.5)2)1/2, and residues with ΔHN > 0.05 ppm are indicated with arrows. The average ΔHN for resonances not shifted by peptide binding was ∼0.01 ppm. C, ΔHN chemical shift changes induced by CHMP1B(181–199) binding for all backbone amides within LIP5(MIT)2. D, positions of LIP5(MIT)2 backbone amide chemical shifts induced by CHMP1B(181–199) binding. Both sides of LIP5(MIT)2 are shown (space-filling models), with shifted residues shown in red (ΔHN ≥ 0.05 ppm) and unshifted residues in MIT1 and MIT2 shown in green and blue, respectively. The position of a (hypothetical) bound MIM1 helix was modeled by overlaying the LIP5 MIT1 module onto the structure of the VPS4A MIT-CHMP1A(180–191) complex (Protein Data Bank code 2JQ9) (36). The chemical shift mapping data indicate that CHMP1B(181–199) binds on the helix 2/3 face of the first LIP5 MIT module, in good agreement with the mutational analysis shown in Fig. 3B. Very similar mapping data were also obtained for the CHMP2A(206–222) construct (data not shown).

