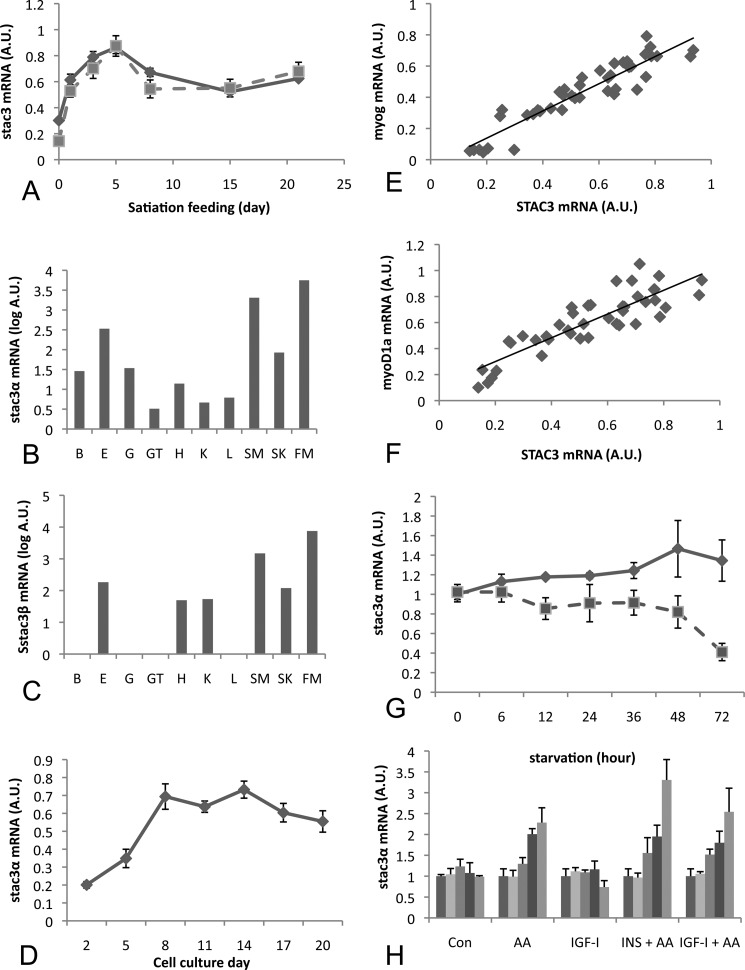
FIGURE 2.
Quantitative PCR analysis of stac3 gene expression in Atlantic salmon. A, mRNA expression profile for Ss stac3α and -β in fish fed a reduced ration for 28 days (day 0) followed by refeeding to satiation for 21 days. B, tissue distribution of Ss stac3α mRNA in gill (G), gut (GT), kidney (K), heart (H), liver (L), eye (E), fast muscle (FM), slow muscle (SM), and skin (S). C, tissue distribution for Ss stac3β as described for B. D, stac3α mRNA levels increase during the maturation of an Atlantic salmon primary myogenic cell culture, and its expression is highly correlated with myog (E) and myoD (F). G, Ss stac3α mRNA levels are decreased in cells starved of amino acid and serum for 72 h (dashed line), when compared with controls (solid line). H, in cells starved for 72 h, Ss stac3α mRNA expression increases in response to amino acid stimulation, but not to Igf-I. Vertical bars represent 0, 3, 6, 12, and 24 h poststimulation.

