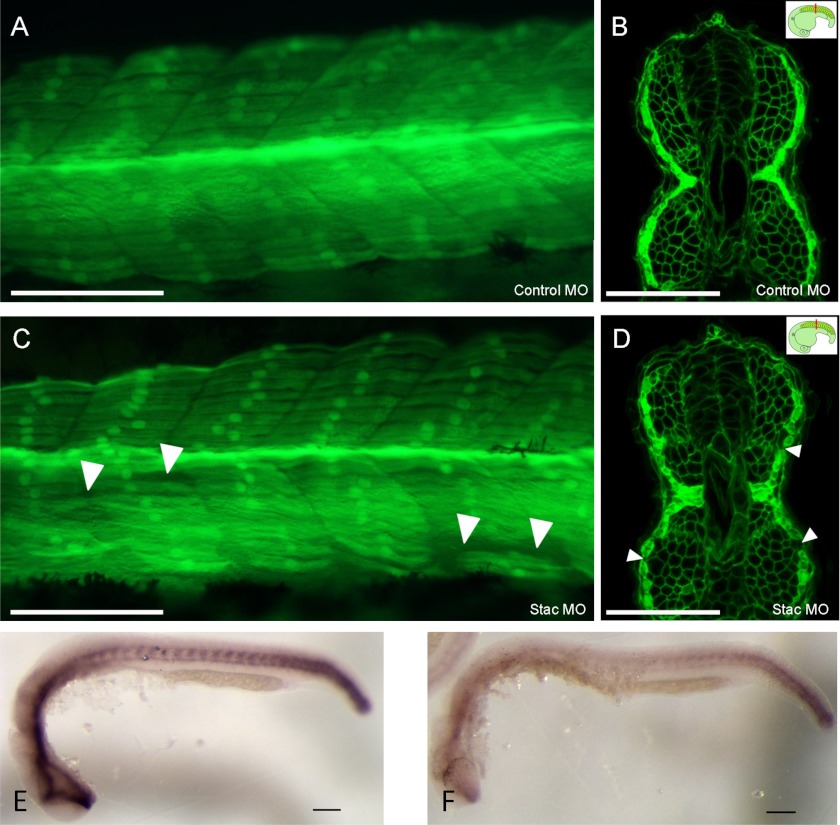
FIGURE 4.
Injection of morpholinos in Tg(sMHC-GFP:β-actin-GFPcaax) embryos at 24 h postfertilization. A and B, Mo-control shows normal slow muscle fiber morphology (dose 1.5 ng). A and B, Mo-stac3 shows abnormal slow muscle fiber morphology including loss of slow muscle fibers (white arrowheads) (dose 1.5 ng). Lateral view is shown in A and C. Confocal image of transverse vibratome sections in B and D, insets shows the plane of section cut immediately after the yolk (red line). Expression of ptc1 is reduced in morphant embryos (F) when compared with controls (E). Scale bars represent 100 μm.

