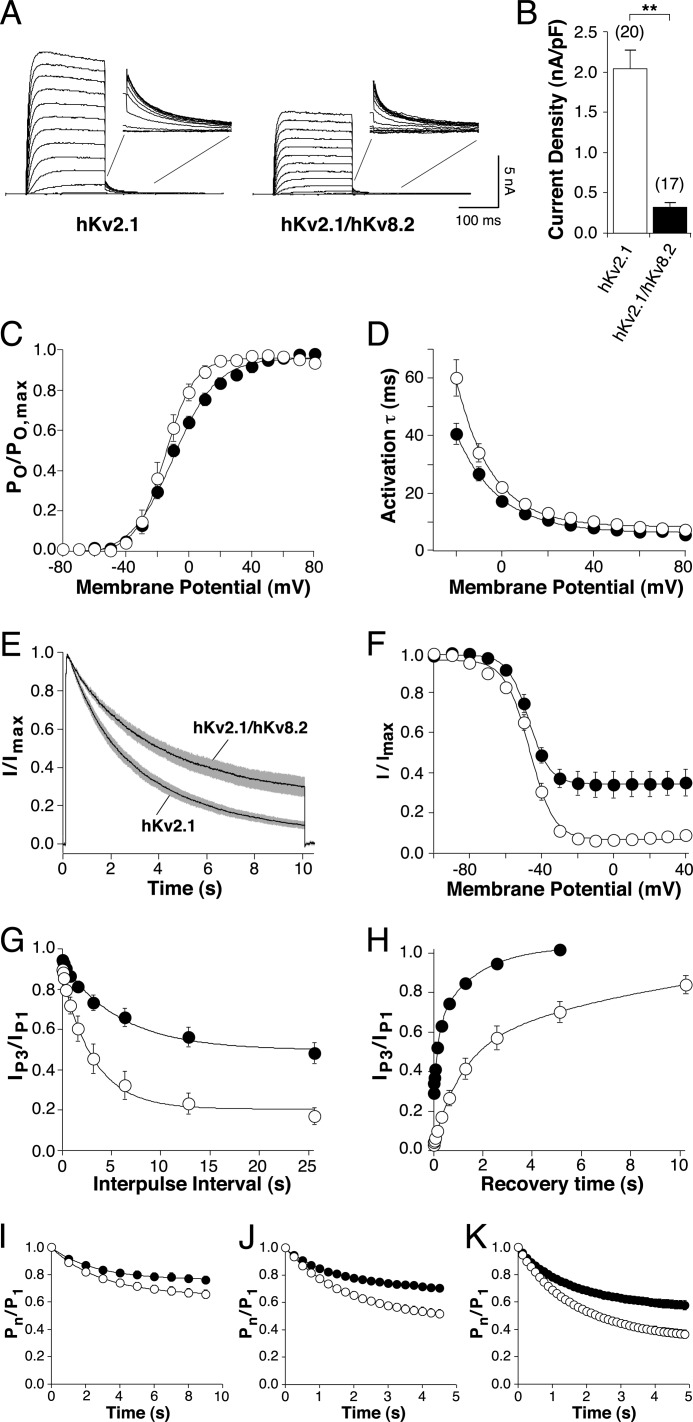
FIGURE 2.
Comparison of electrophysiological properties of hKv2.1 and hKv2.1/hKv8.2. Throughout the figure, open circle is used for hKv2.1, and filled circle is used for hKv2.1/hKv8.2. A, hKv2.1 and hKv2.1/hKv8.2 currents recorded from HEK293 cells transfected with 90 ng of hKv2.1-pcDNA3 or cotransfected with hKv2.1-pcDNA3 and hKv8.2-pcDNA3 in a 1:1 ratio. Currents were elicited by 200-ms voltage steps from −80 to +80 mV (10-mV increments) followed by a step to −40 mV. B, bar diagram comparing the current densities obtained for homomeric hKv2.1 and heteromeric hKv2.1/hKv8.2 at +30 mV. C, voltage dependence of activation. Amplitudes of the tail currents obtained by the pulse protocol described in A were used. After normalization, the relative open probabilities derived from the initial currents were plotted against the voltage of the depolarizing step and fitted with a Boltzmann function (n = 6–8). D, voltage dependence of the time course of activation. τact was obtained from mono-exponential fits to current traces elicited by the 200-ms voltage steps described in A and plotted as a function of the test potential. E, inactivation from the open state. Currents elicited by a 10-s voltage step from −80 mV to +30 mV. Solid lines represent mean currents, and gray shading indicates the S.E. (n = 7–8). F, voltage dependence of the steady-state inactivation. Channels were inactivated for 20 s (hKv2.1) or 30 s (hKv2.1/hKv8.2) at prepulse potentials ranging from −100 to +40 mV, followed by a test pulse to +60 mV to activate residual noninactivated channels. The normalized amplitudes were plotted against the prepulse potentials and fitted with a Boltzmann function (n = 7–9). G, inactivation from intermediate closed states. After a 200-ms test pulse (P1) to +60 mV, channels were inactivated for an increasing time at −40 mV (P2), after which another 200-ms test pulse (P3) to +60 mV was applied. The proportion of current remaining (IP3/IP1) was plotted against the time spent at (P2) (n = 8). H, time dependence of recovery from inactivation. After a 200-ms test pulse to +60 mV (P1), a 20-s (hKv2.1) or 30-s (hKv2.1/hKv8.2) conditioning pulse to −10 mV was applied to obtain maximal inactivation. Recovery was measured by another 200-ms test pulse to +60 mV (P3) after increasing intervals at the recovery potential (−80 mV, P2). The proportion of recovered current (IP3/IP1) was plotted against the time spent at the recovery potential (n = 6). I–K, cumulative inactivation. Repeated depolarizing steps between −80 and +60 mV were applied at a frequency of 1 Hz (I), 4 Hz (J), or 8 Hz (K) with equal time spent at −80 and +60 mV. The normalized current amplitudes at each depolarization were plotted against time (n = 6–13).

