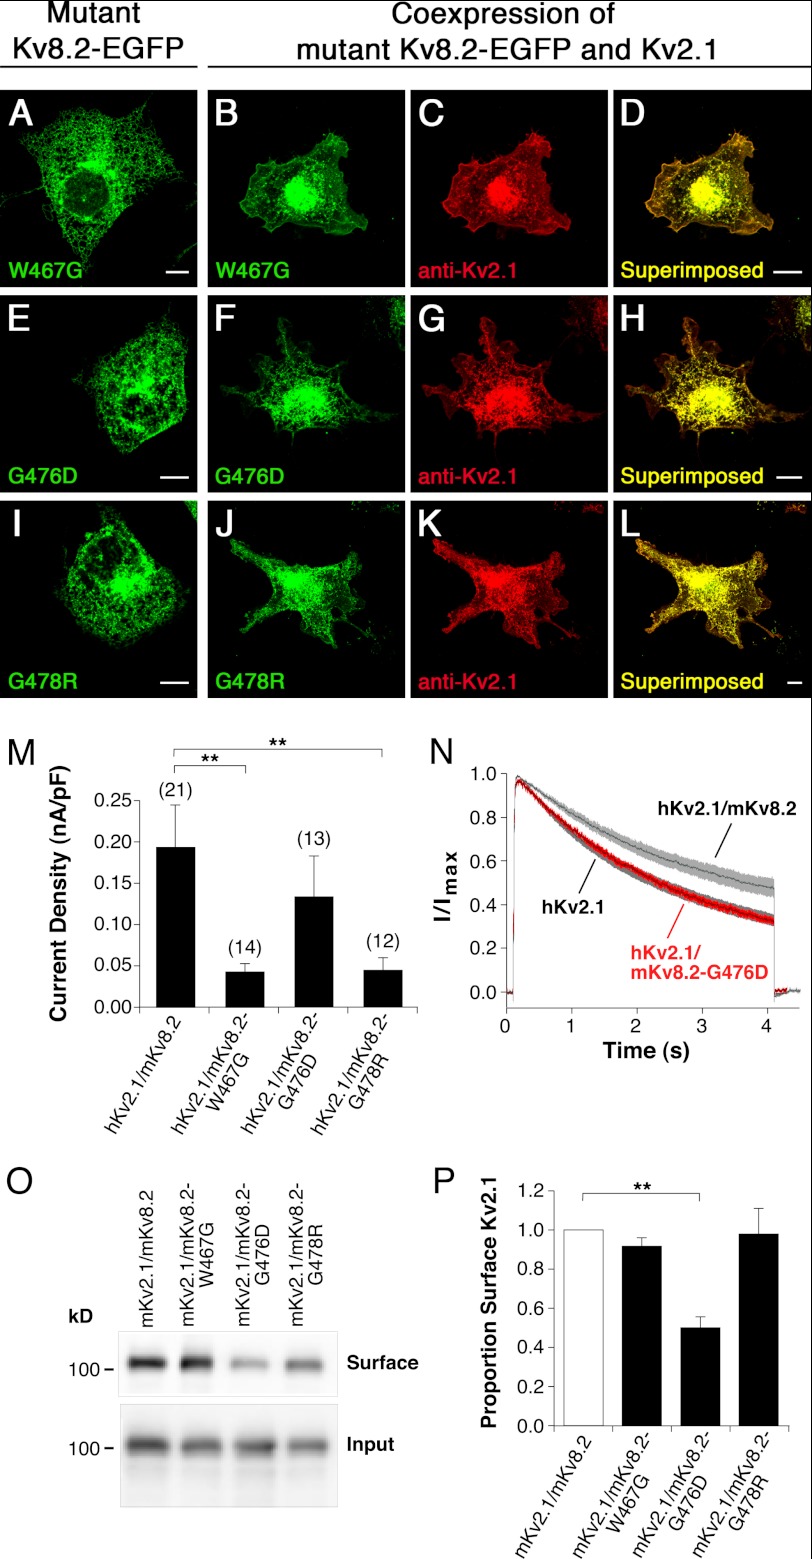
FIGURE 4.
Characterization of missense mutations located in the pore region of Kv8.2 (mKv8.2-W467G, mKv8.2-G476D, and mKv8.2-G478R). Mutant α-subunits were expressed alone or together with mKv2.1 α-subunits in COS7L cells in a 1:3 ratio. Confocal pictures show the following. A, mKv8.2-W467G-EGFP; B and C, coexpression of mKv8.2-W467G-EGFP with mKv2.1; D, superimposition of C and D; E, mKv8.2-G476D-EGFP; F and G, coexpression of mKv8.2-G476D-EGFP with mKv2.1; H, superimposition of F and G; I, mKv8.2-G478R-EGFP; J and K, coexpression of mKv8.2-G478R-EGFP with mKv2.1; L, superimposition of J and K. Green fluorescence indicates mutant mKv8.2-EGFP subunits; red fluorescence indicates mKv2.1 subunits. Scale bars, 10 μm. M, current densities observed upon a voltage step to +30 mV in HEK293 cells expressing the indicated α-subunits: hKv2.1/mKv8.2 (0.19 ± 0.05 nA/pF, n = 21), hKv2.1/mKv8.2-W467G (0.043 ± 0.011 nA/pF, n = 14), hKv2.1/mKv8.2-G476D (0.13 ± 0.05 nA/pF, n = 13), and hKv2.1/mKv8.2-G478R (0.045 ± 0.015 nA/pF, n = 12). N, comparison of the inactivation from the open state of hKv2.1, hKv2.1/mKv8.2 (gray), and hKv2.1/mKv8.2-G476D (red). Currents were elicited by a 4-s depolarization to +30 mV. Solid lines represent the mean currents with shading indicating the S.E. O, surface expression of mKv2.1. The level of surface expression of mKv2.1 upon coexpression with mKv8.2, mKv8.2-W467G, mKv8.2-G476D, or mKv8.2-G478R in COS7L cells is shown. P, bar diagram showing the proportion of mKv2.1 in the plasma membrane for the different coexpressions indicated (n = 3). The expression level of the mKv2.1 heteromer was set to 1.

