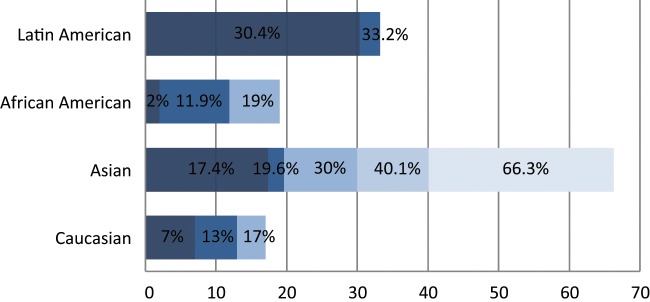
Figure 2.
Spectrum of EGFR oncogenic driver mutations among different racial groups with NSCLC. The different color shades represent EGFR mutational rates reported by different studies. Data on the African American and Latin American cohorts are based on a limited number of studies available.46,55-58 Data on the Asian and white cohorts are abundant over recent years, and several representative studies were selected for graphical representation here.23,24,28,46,56,101,143

