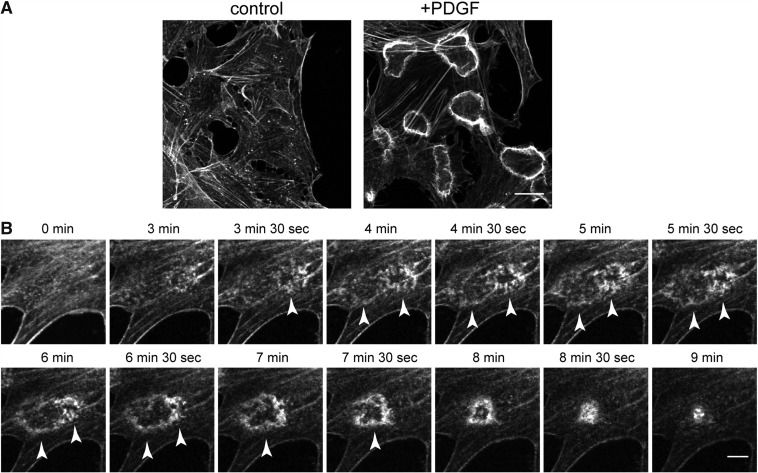
Fig. 1.
CDR formation in response to growth factor stimulation. (A) CDR formation in NIH3T3 cells before (left panel) or after (right panel) PDGF stimulation. F-actin staining with rhodamine-phalloidin is shown. Bar, 10 µm. (B) Time-lapse images of actin cytoskeleton during CDR formation probed by Lifeact-mCherry transfected in NIH3T3 cells. Arrowheads indicate precursor and matured dorsal ruffles. Bar, 10 µm.

