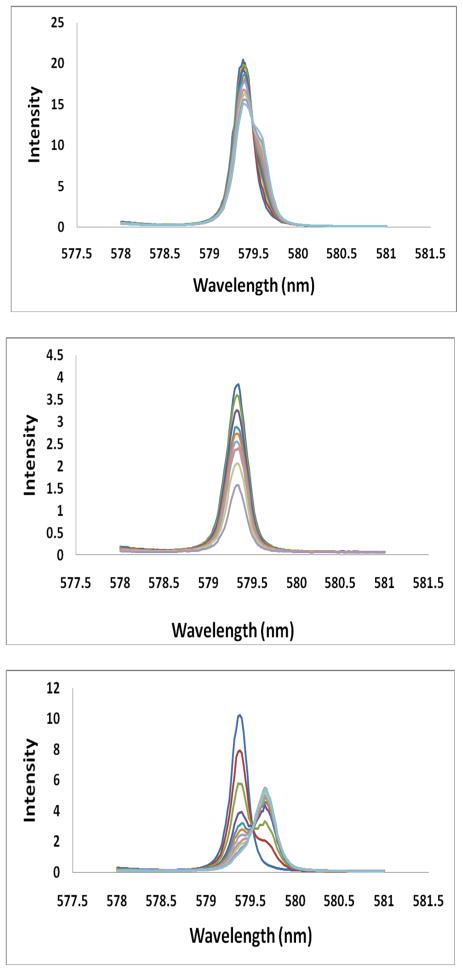
Figure 1.
Eu(III) 7F0→5D0, excitation spectra (λem = 628 ± 27 nm). All solutions contain 20 mM HEPES, pH 7.2, 100 mM NaCl. Top: addition of lactate (0 – 40 mM) to 1.00 mM Eu(S-THP) gives decrease in 579.3nm peak, middle: phosphate (0 – 1.0 mM) added to 100 μM Eu(S-THP) gives decrease in 579.3 nm peak and bottom: citrate (0 – 1 mM) added to 25 μM Eu (S-THP) gives decrease in 579.3 nm peak and increase in 579.64 nm peak.

