
Figure 3. CXCL1/2 promote metastasis through myeloid cell-derived S100A8/9.
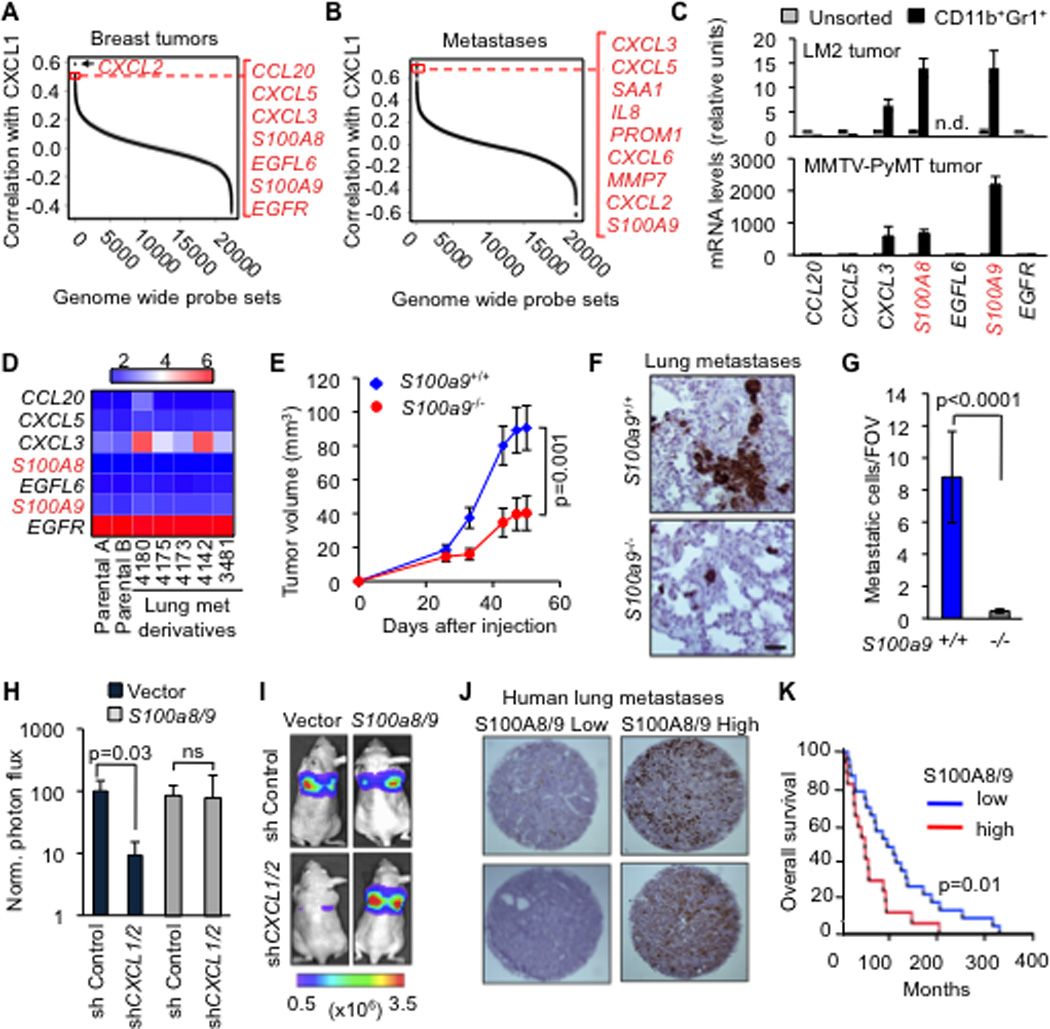
(A–B) Gene ranking according to correlation with CXCL1 expression. Expression data from breast cancer primary and metastases microarray datasets. Genes were filtered based on extracellular localization to identify paracrine mediators. The list on the right shows genes that correlate highest with CXCL1. Complete list of CXCL1 correlating genes in Tables S3 and S4.
(C) Expression of the top seven CXCL1-associated genes in (A) in the sorted CD11b+Gr1+ cells compared to unsorted tumor determined by qRT-PCR analysis from LM2 breast cancer model and MMTV-PyMT autochthonous mammary cancer model. Error bars represent 95% confidence interval. Data is representative of two independent experiments.
(D) Expression of top seven CXCL1-associated genes in breast cancer cell lines based on microarray gene expression data.
(E) LM2 tumor growth curves in mice transplanted with either S100a9+/+ or S100a9−/− bone marrow. Data points show averages ± SEM. n=19 tumors per group. P value was determined by Student’s t-test.
(F–G) Representative images and quantitation of metastatic cells in lungs detected by vimentin immunohistochemistry at 60 days after inoculation of LM2 tumors, in mice that were transplanted with S100a9+/+ or S100a9−/− bone marrow. Scale bar equals 60µm. Data points show averages ± SEM. n=4–6 mice per group. P value was determined by Student’s t-test.
(H–I) Lung colonization by LM2 cells transduced with control shRNA or shCXCL1/2, with or without ectopic expression of S100a8/9. Lung colonization was assessed by non-invasive bioluminescence imaging (BLI) at 4 weeks after tail vein injection of the cells. (H) Normalized BLI quantification (I) images represented by photon flux of lung colonization ability. Data are averages ± SEM. n=4–6 per group. ns, not significant. P value was determined by two-tailed Wilcoxon Rank Sum test.
(J) Representative TMA cores containing lung metastasis samples from breast cancer patients stained for total S100A8/9.
(K) Kaplan-Meier overall survival analysis on breast cancer patients classified by total S100A8/9 expression in lung metastasis (see panel J) n=23 for S100A8/9 low group, n=17 for S100A8/9 high group. P-values were calculated by log-rank test.
See also Figure S3 and Tables S3 and S4