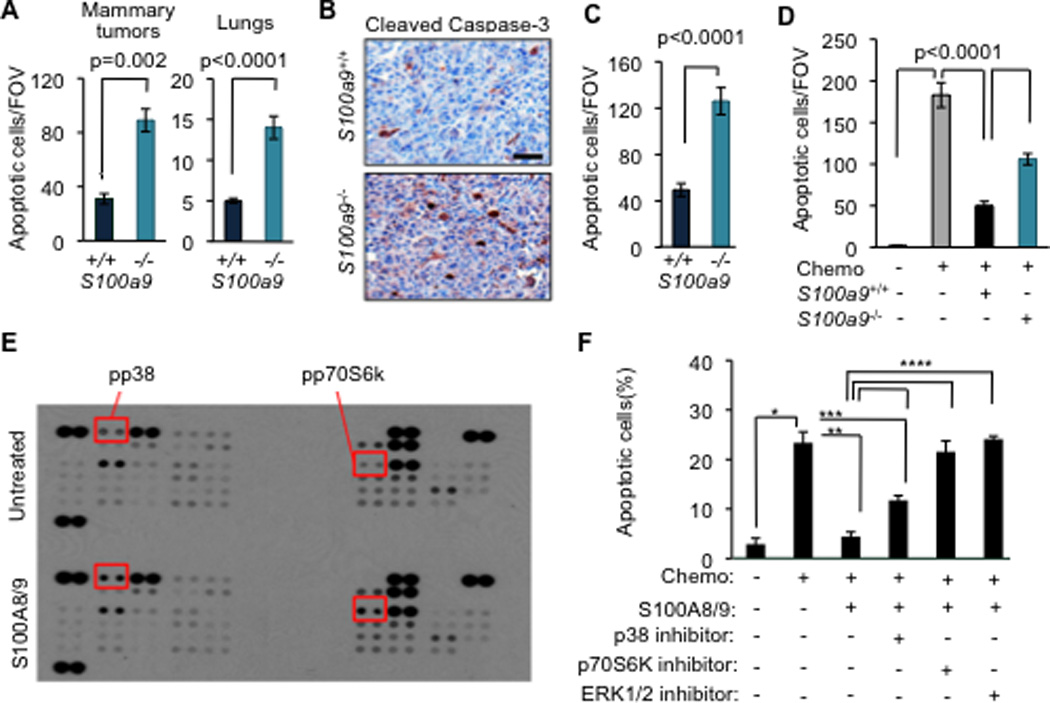
Figure 4. S100A8/9 promotes breast cancer cell survival under chemotherapy.

(A) Quantitation of apoptosis by cleaved caspase-3 staining in tumors and TUNEL assay in lungs in mice transplanted with S100a9+/+ or S100a9−/− bone marrow at 60 days after LM2 tumor inoculation into the mammary fat pad. Data are averages ± SEM. n=4–6 mice per group. P values were determined by Student’s t-test.
(B–C) Representative images and quantification of apoptosis by cleaved caspase 3 staining in LM2 tumors from mice transplanted with either S100a9+/+ or S100a9−/− bone marrow and subsequently treated with a combination of doxorubicin and cyclophosphamide chemotherapy (AC regimen, chemo) once weekly for 3 weeks. Scale bar represents 32µm. Data are averages ± SEM. n=5–6 tumors per group. P values were determined by Student’s t-test.
(D) TUNEL analysis detecting apoptotic cancer cells in co-culture assay. LM2 cancer cells were cultured alone or overnight in the presence of S100a9+/+ or S100a9−/− bone marrow cells and subsequently treated with chemotherapeutic drug (Chemo), doxorubicin (0.8µM). Data are average ± SEM of triplicates. P values determined by Student’s t-test.
(E) Screening of signaling pathways activated by S100A8/9 in LM2 metastatic cancer cells by probing human phospho-kinase array with lysates from cells treated with either PBS or 10µg/ml recombinant S100A8/9. Shorter exposure of the same blot shown in S4. Proteins showing increased phosphorylation upon S100A8/9 treatment are highlighted.
(F) TUNEL analysis detecting apoptotic cancer cells in co-culture assay upon pharmacological inhibition of p38, p70S6K and ERK pathways in the presence of recombinant S100A8/9. LM2 cancer cells were pretreated with 10µg/ml of S100A8/9 for 1 h and subsequently treated with doxorubicin (0.8µM, chemo) either alone or in the presence of 5µM of p38 inhibitor SB203580 or 10µM of p70S6K inhibitor PF4708671 or 10µM of ERK inhibitor FR180204 for 16h. LM2 cells treated with saline were used as controls. Quantification of apoptosis was done by calculating the percentage of TUNEL+/DAPI+ cells per FOV. Data are shown as average ± SEM from triplicates. *, **, ***, **** denote p=0.004, 0.02, 0.04, 0.01, respectively. P values were determined by Student’s t-test.
See also Figure S4
