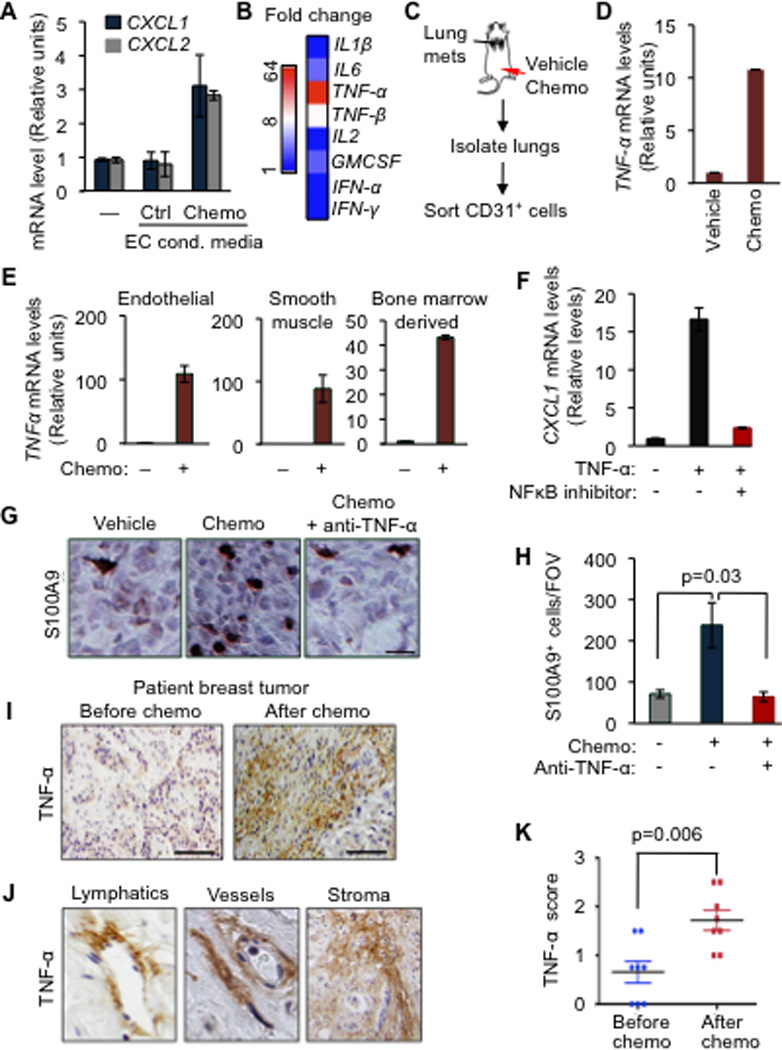
Figure 6. TNF-α from chemotherapy-activated stroma boosts the CXCL1/2 survival axis.

(A) CXCL1/2 expression in MDA231-LM2 cancer cells either alone (–) or in the presence of conditioned media from primary human umbilical vein endothelial cells (HUVEC) that were either untreated (control) or treated with 0.8µM doxorubicin (chemo), as determined by qRT-PCR. Data represent average expression ± SEM.
(B) Heatmap representing expression changes in inflammatory cytokines in HUVEC treated with doxorubicin (0.8µM). Heatmap generated by conversion of qRT-PCR data that was normalized to β2M as housekeeping gene control.
(C) Schematic representation of experimental procedures. Lung endothelial cells were purified from LM2 tumor-bearing mice that were treated with chemotherapy. Mice showing established lung metastasis 7 weeks after tail-vein injection of LM2 cells were either treated with vehicle (saline) or AC chemotherapy. CD31+ endothelial cells were purified from dissociated lung tissue by flow cytometry.
(D) TNF-α expression in isolated CD31+ lung endothelial cells from doxorubicin treated tumor-bearing mice. n=2–4 mice per group. Data represent averages ± SEM.
(E) TNF-α expression in the indicated primary cells upon doxorubicin chemotherapy treatment for 16h as determined by qRT-PCR analysis. Error bars represent 95% confidence interval for qRT-PCR analysis. Data is representative of three independent experiments.
(F) CXCL1 expression in LM2 cancer cells treated with vehicle or TNF-α for 2h in the presence of a 100µM NBD (NEMO-binding domain) inhibitory peptide of the NF-κB pathway. Data represent averages ± SEM.
(G–H) Representative images of S100A9 expression by immunohistochemistry and quantitation of S100A9 positive cells in tumors from control or AC chemotherapy treated mice, with or without anti-TNF-α blocking antibody (infliximab). Mice bearing CN34LM1 tumors were treated once weekly for five weeks starting at 10 weeks after tumor inoculation, with PBS vehicle, AC chemotherapy (chemo), or chemotherapy plus anti-TNF-α antibody. Scale bar, 32µm. Data are averages ± SEM. n=3–5 mice/group. P values were calculated by Student’s t-test.
(I) Immunohistochemical analysis of TNF-α expression in human primary breast tumor before and after chemotherapy treatment. Scale bar equals 120µm.
(J) Stromal rich areas containing lymphatic vessels, blood vessels and fibroblasts with high TNF-α staining from primary breast tumors after AC chemotherapy treatment. Magnified fields from images taken at 40× magnification.
(K) Comparison of stromal TNF-α expression score in paired breast tumors before and after chemotherapy. n=8 patients. P value was determined by Wilcoxon’s paired test, comparing pre and post-treatment levels from each patient.
See also Figure S6
