Figure 6.

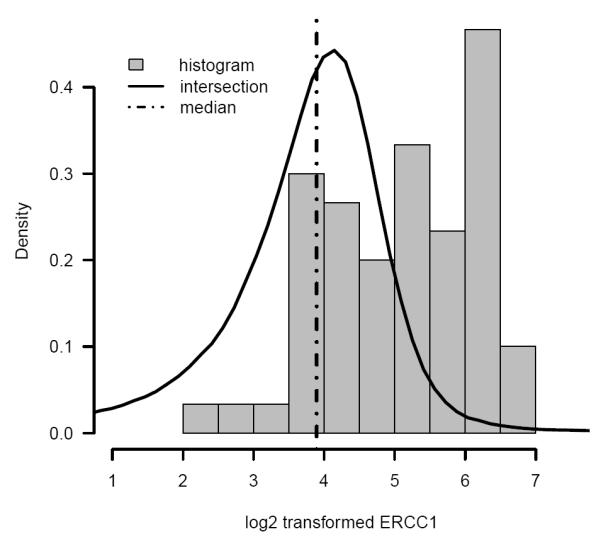
Posterior distribution of intersection (solid line), median of posterior distribution of intersection (dash dotted line), and histogram of log2 transformed observed ERCC1 protein activity in the NSCLC study.

Posterior distribution of intersection (solid line), median of posterior distribution of intersection (dash dotted line), and histogram of log2 transformed observed ERCC1 protein activity in the NSCLC study.