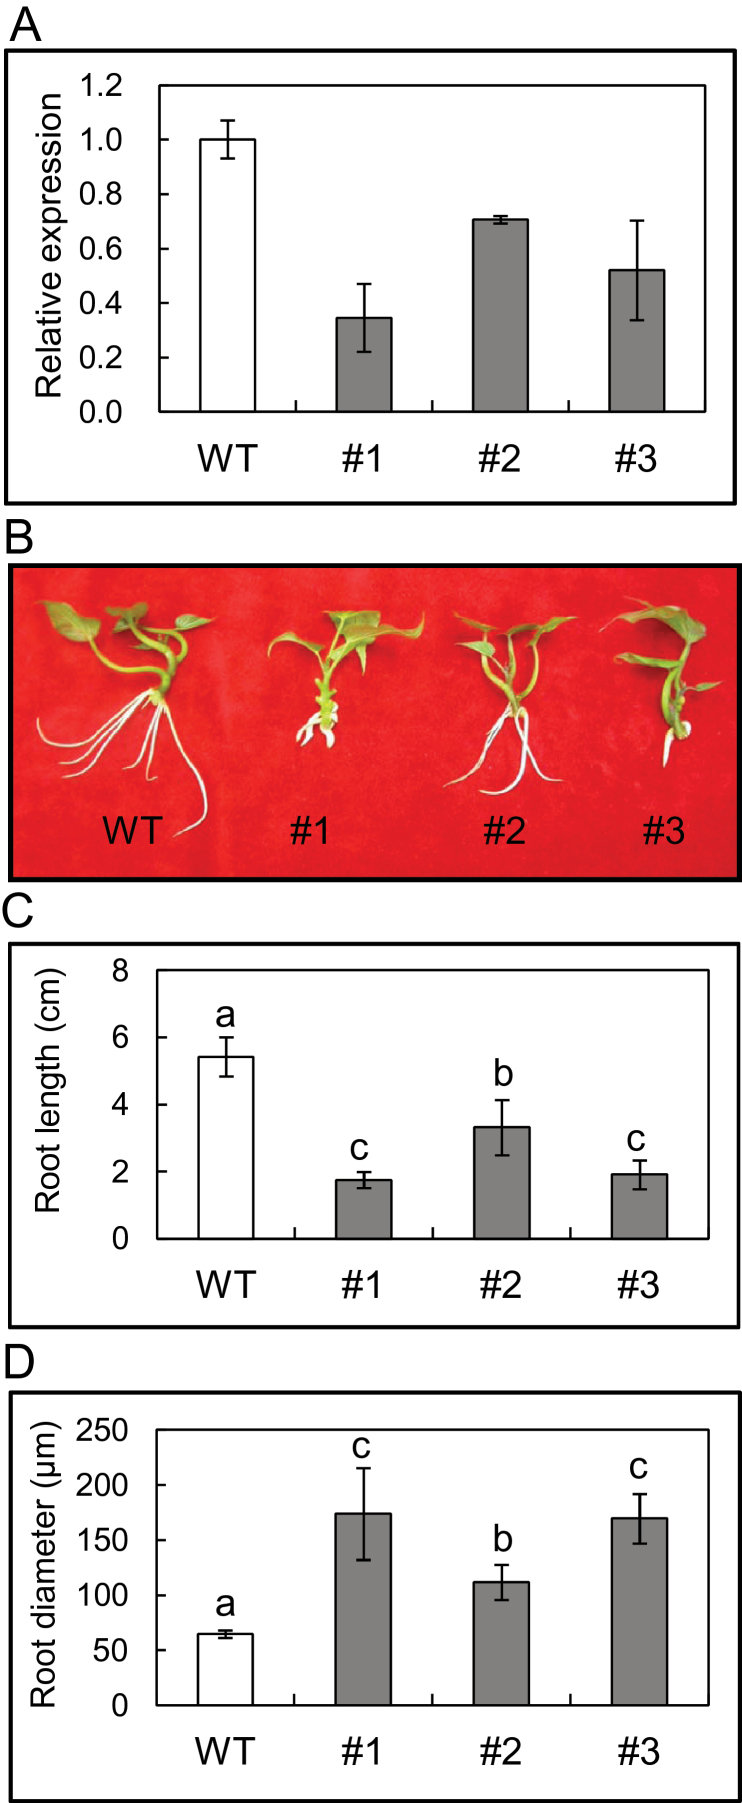
Fig. 3.
Characterization of IbEXP1-antisense sweetpotato plants. (A) Transcript levels of IbEXP1 in IbEXP1-antisense plants. Real-time RT-PCR analysis was carried out with total RNAs extracted from fibrous roots grown in vitro. Data were normalized to those for the endogenous β-tubulin gene. Error bars indicate the standard deviation (SD) between three technical replicates measured on fibrous roots collected from at least three different sweetpotato plantlets. (B) Morphology of the IbEXP1-antisense plants. Pictures were taken at 10 d after planting. (C) Root length of IbEXP1-antisense plants. Root length was measured with the three longest roots of each plant. (D) Root diameter of IbEXP1-antisense plants. Root diameter was measured with a dial caliper by measuring the thickest root of each plant. (C and D) Data were collected from sweetpotato plants cultured in vitro for 10 d after planting and are the means ±SD from three separate measurements of three individual plants. Different letters above the bars indicate significantly different means (P < 0.05) as analysed by Duncan’s multiple range test using the SAS statistical program (SAS Institute, Cary, NC, USA). (A–D) Numbers #1-#3 represent IbEXP1-antisense sweetpotato lines #1-#3, respectively. WT, wild type. (This figure is available in colour at JXB online.)

