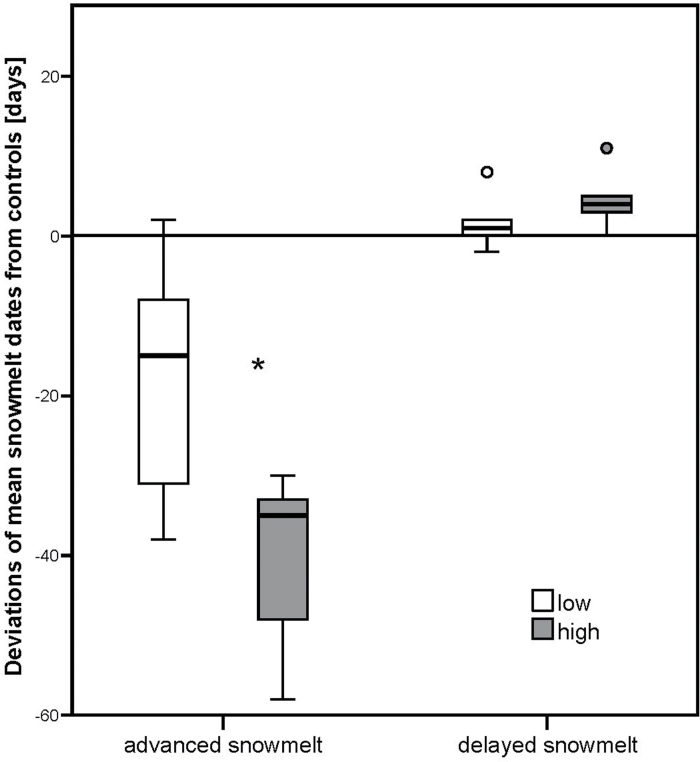
Fig. 2.
Deviations from controls of mean snowmelt dates on advanced and delayed snowmelt plots, derived from each altitudinal site singly and then separated by low (600–1300 m) and high (1300–2000 m) altitudes. The asterisk indicates significant differences in snow melting date between lower and higher sites (P <0.05).

