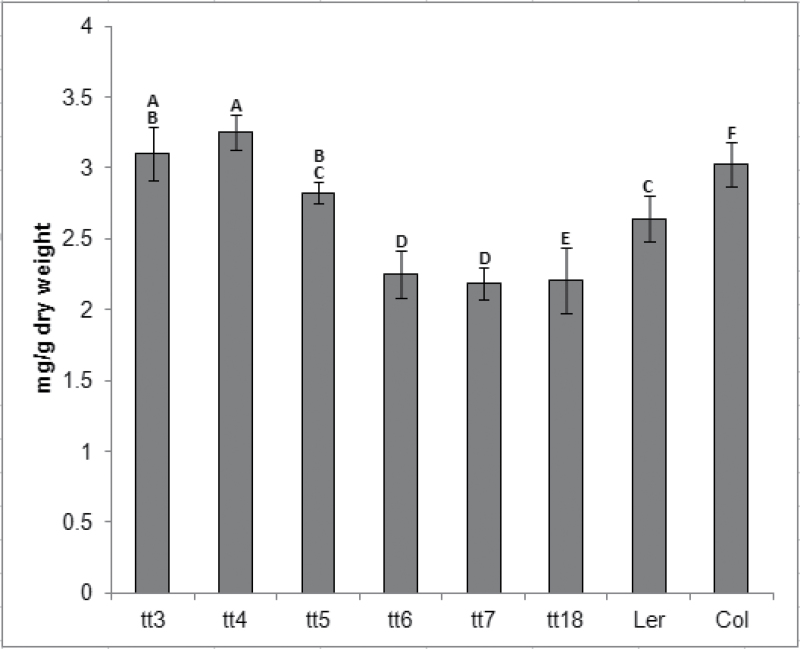
Fig. 2.
Chlorophyll a/b content in rosette leaves of anthocyanin production mutants and wild-type controls. The measurements were taken at peak chlorophyll levels around the time of floral transition. All data are the mean ±SD. Bars with the same letters are not statistically different according to the one-way ANOVA LSD test (P < 0.05, n=5).

