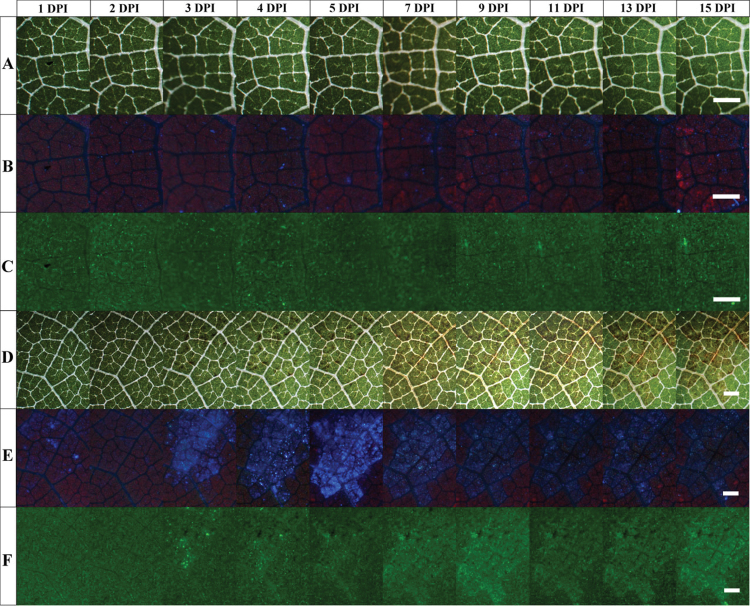
Fig. 1.
Images of the abaxial side of a V. vinifera cv. Cabernet Sauvignon leaf during P. viticola infection. Numbers of days post-inoculation (DPI) by P. viticola are increasing from left to right. (A–C) Control region (2.28×1.71mm). (D–F) Inoculated region (4.07×3.04mm). A and D are white-light transmission images. B and E are images of UV-excited visible autofluorescence. C and F are images of blue-excited green autofluorescence. Images were taken daily, but not all are shown. Bars, 500 µm. For details, see the Materials and methods.

