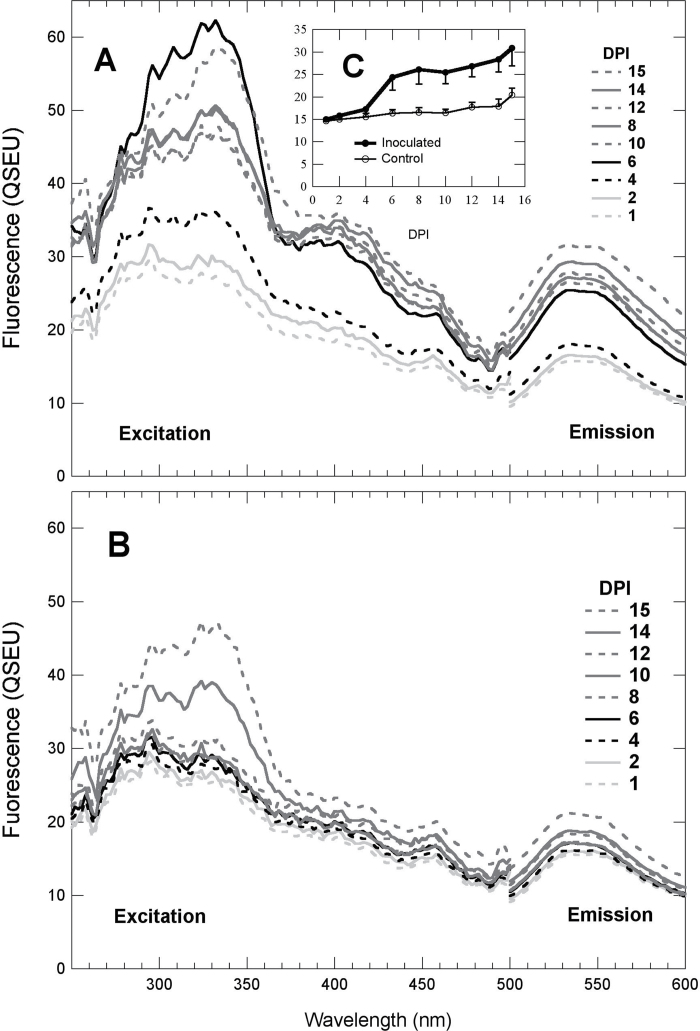
Fig. 3.
Green autofluorescence (GF) emission spectra and associated excitation spectra of grapevine leaves during P. viticola infection. Daily fluorescence excitation spectra with an emission at 525nm and emission spectra with the blue-excitation wavelength set at 430nm were obtained as described in Fig. 2. (A) Mean spectra of inoculated spots, (B) mean spectra of control spots, (C) daily means and standard deviation of GF (430nm excitation and 525nm emission).

