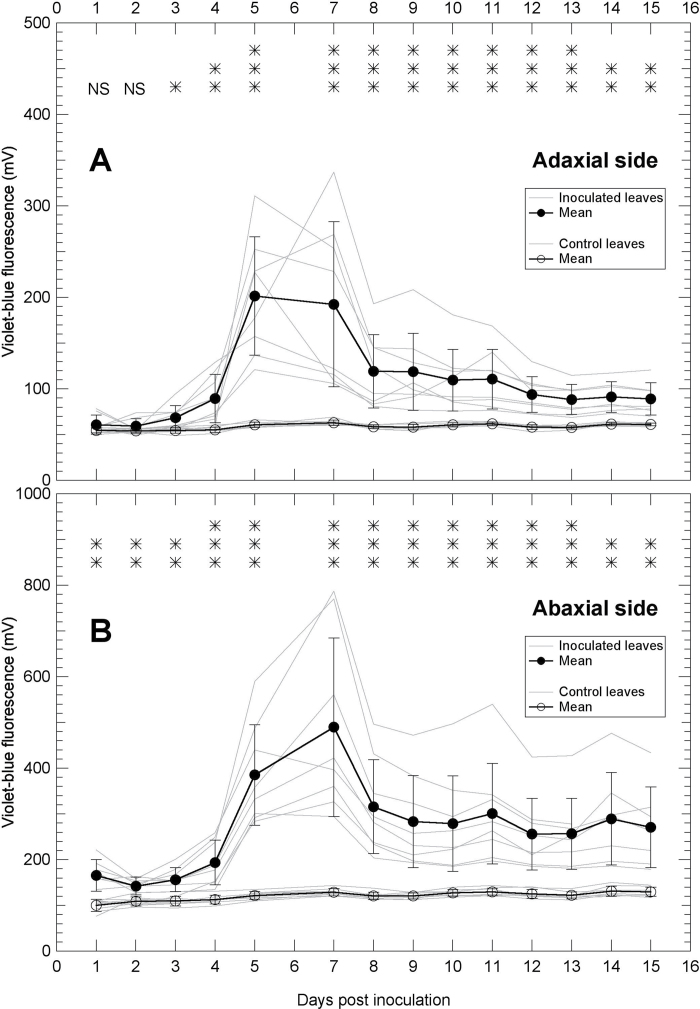
Fig. 4.
Changes in violet–blue autofluorescence of grapevine leaves during P. viticola infection followed by the Mx-330 sensor. A large surface (6cm diameter) of both the adaxial (A) and the abaxial (B) side of Cabernet Sauvignon leaves was sensed from the first to the 15th day after inoculation. Note that the y-axis scale in B is double that in A. Grey lines are daily kinetics of individual leaves and bold lines are means with standard deviations of eight inoculated leaves and eight control leaves. The significance of the difference between control and inoculated leaves for each day is indicated on the top of the graphs: NS, not significant; *P < 0.05; **P < 0.01; ***P < 0.001.

