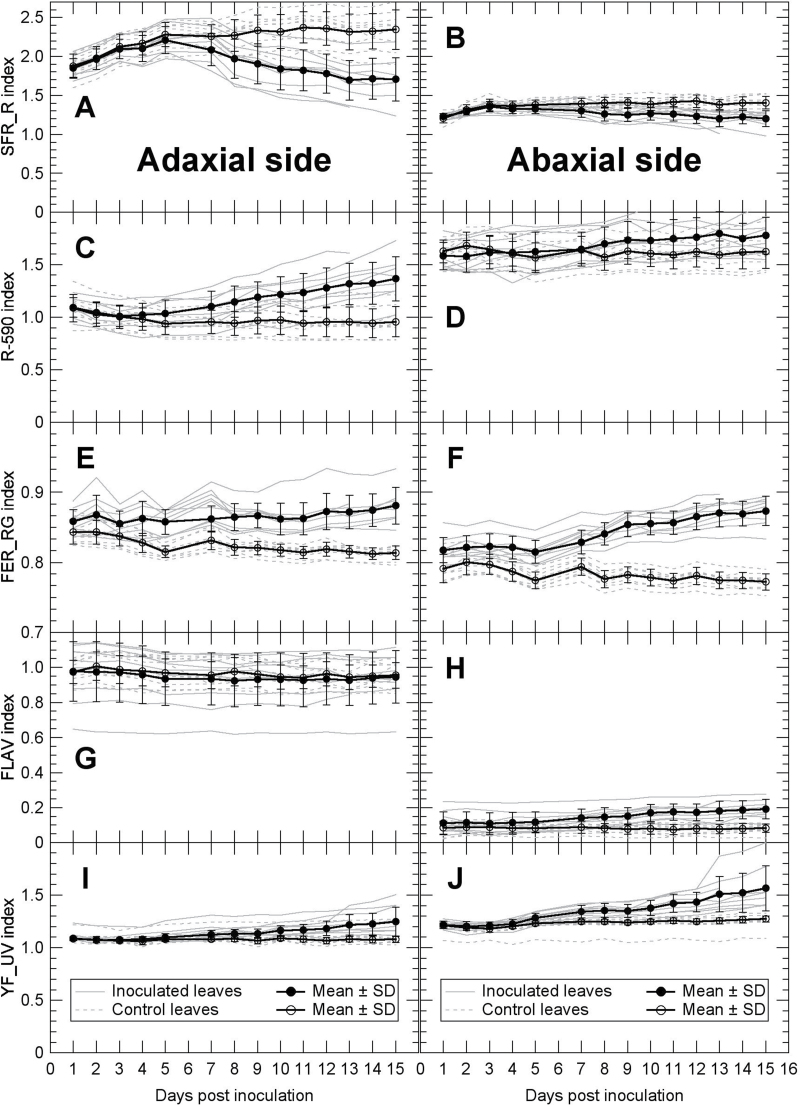
Fig. 5.
Changes in Multiplex 3 indices during P. viticola infection of grapevine leaves. Both adaxial (A, C, E, G, I) and abaxial (B, D, F, H, J) side of leaves were measured on the same leaves shown in Fig. 4. Grey lines are individual leaves and bold lines are means with standard deviations of nine inoculated leaves and nine control leaves. For the description of different Multiplex 3 indices, see the Materials and methods.

