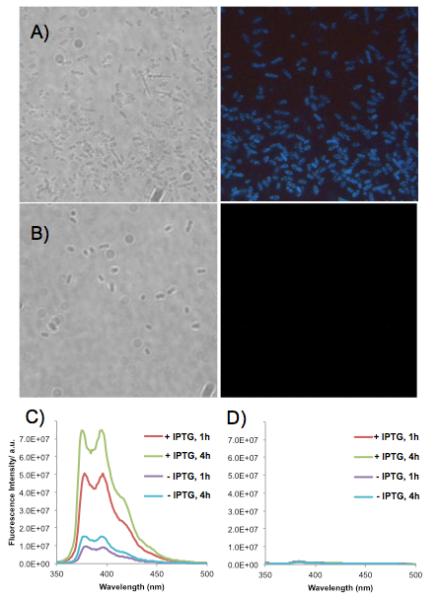
Figure 4.

Images and spectra of sensors with bacterial cells. (A,B) Bright field (left) and fluorescence microscope images (right) of Escherichia coli (BW(310)DE3udg(-)) cells transformed with the pET28a plasmid containing the Afu UDG gene. Cells were incubated in a solution containing (A) probe 1 or (B) thymine control probe 2 at 5 μM for 4 h (65 °C). Excitation 330-380 nm; emission >420 nm. (C,D) Spectra of bacterial solutions diluted tenfold (excitation 340 nm). (C) Probe 1 with bacteria expressing Afu UDG, incubated with probe for 1 or 4 h; (D) Control probe 2 with bacteria under the same conditions.
