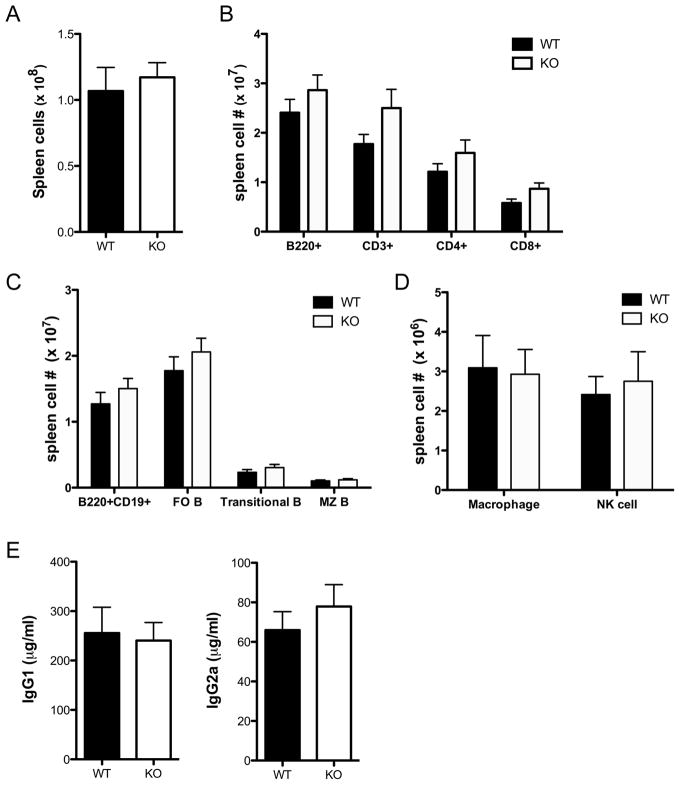
Figure 2. Distribution of immune cells in BALB/c Tim-1 deficient mice.
A. Numbers of splenic cells in wild-type and Tim-1 deficient mice. B. Numbers of B220+, CD3+, CD4+B220− and CD8+B220- splenocytes in wild-type and Tim-1-deficient mice. C. Numbers of B220+ splenocyte B cell subsets in wild-type and Tim-1 deficient mice D. Numbers of splenic macrophages (CD3−B220−CD11b+GR1−) and NK cells (CD3−B220−DX5+CD122+). n=9 WT and 9 Tim-1 KO mice, age 9–13 weeks (A–D). E. ELISA for total serum IgG1 and IgG2a. n=6 WT and 6 Tim-1 KO mice, age 9–13 weeks (E). Statistical analysis was prepared with unpaired two-tailed t tests. Error bars represent standard error of mean.

