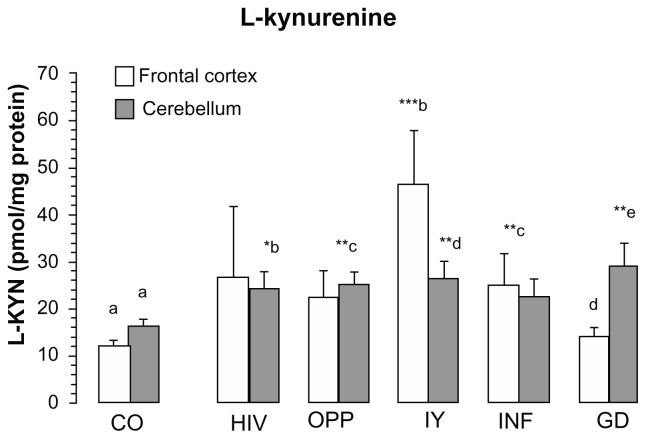
Figure 2.
L-kynurenine content in frontal cortex and cerebellum of different pathological subgroups HIV-1 infection.
Notes: Values represent the mean ± SEM: Control (CO, n = 16); Pathological subgroups: HIV in brain tissue by immunocytochemistry (HIV, n = 6); opportunistic infection (OPP, n = 15); malignant lymphoma (LY, n = 5); infarction of brain (INF, n = 5) and glial dystrophy (GD, n = 5). Significance: *P < 0.05; **P < 0.01; ***P < 0.001 compared with control. Statistical analysis for frontal cortex: b, d indicate statistical significance at P < 0.05; a, c indicates statistical significance at P < 0.01; a, b indicates statistical significance at P < 0.001, analysis of variance: F = 2.7017, P = 0.0319. Statistical analysis for cerebellum: a, b indicates statistical significance at P < 0.05; a, c; a, d; a, e indicate statistical significance at P < 0.01, one-way analysis of variance: F = 2.9019, P = 0.0233.

