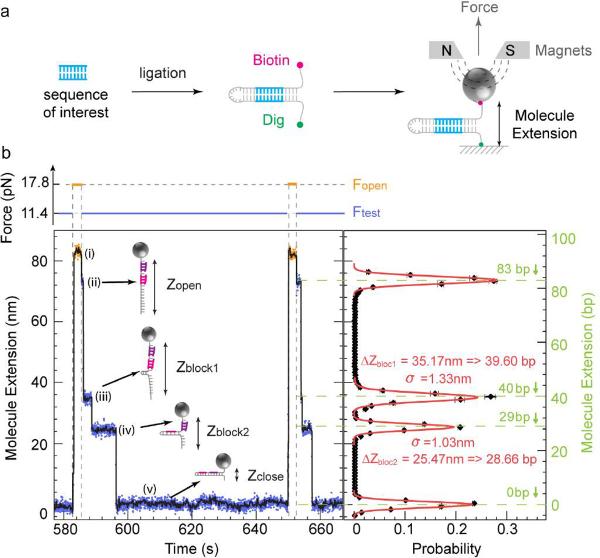
Figure 1.
Detection of oligonucleotide-induced blockages during rehybridization. (a) Hairpin construction design with pre-planted target in the stem. (b) Example of roadblocks due to the hybridization of two oligonucleotides (5'-ACAGCCAGC-3', 5'-ATGACAATCAG-3') on the 83 bps hairpin (see Methods). Left panel: Experimental traces recorded at Fopen = 17.8 pN (orange) and Ftest = 11.4 pN (blue; see force trace at the top). Five different extension levels are observed corresponding from top to bottom to: (i) the open hairpin at Fopen, (ii) the open hairpin at Ftest, (iii) the partially annealed hairpin blocked by the first oligo, (iv) the partially annealed hairpin blocked by the second oligo and (v) the folded hairpin. The black curve corresponds to a 1 s average of the raw data. Right panel: Histogram of blockages (ii)–(iv). The black curve represents the histogram of the number of blockages per cycle at a given extension of the hairpin upon rehybridization at Ftest: ΔZ = Zblock − Zclose in base pairs obtained from ~23 force cycles on a single hairpin. Gaussian fits to the data are shown in red. The variance of these fits (σ ~1 nm) defines the resolution of the apparatus. The roadblocks Zblock1 and Zblock2 are observed at 39.60 and 28.66 bps along the hairpin, in good agreement with the expected position of 40 and 29 bps (shown in green).

