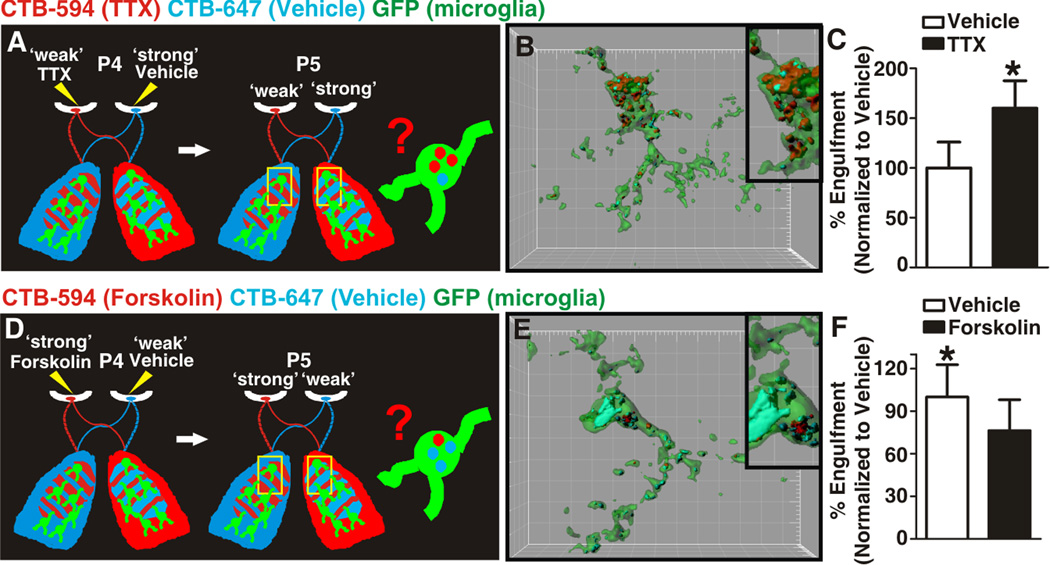
Figure 3. Microglia-mediated engulfment of RGC inputs is regulated by neural activity.
A, D Schematic of strategies used for assessing microglia engulfment following disruption of dLGN pruning by manipulation of neuronal activity. B. Representative P5 microglia (green) surface rendered from the border region of ipsilateral and contralateral projections in which left and right eyes were treated with TTX (red) and vehicle (blue), respectively. Inset is an enlarged region demonstrating the increase in engulfment of inputs from the ‘weaker’, TTX-treated eye (red) as compared to those inputs derived from the ‘stronger’ vehicle-treated eye (blue). Grid line increments = 5 µm. C, Significantly more TTX-treated inputs (black bar) are engulfed as compared to vehicle-treated inputs (white bar). *P<0.04 by Student’s t-test, n=4 mice/treatment. E. Representative P5 microglia (green) surface rendered from the border region of ipsilateral and contralateral projections in which left and right eyes were treated with forskolin (red) and vehicle (blue), respectively. Inset is an enlarged region demonstrating an increase in engulfment of inputs from the ‘weaker’, vehicle-treated eye (blue) as compared to those inputs derived from the ‘stronger’ forskolin-treated eye (red). Grid line increments = 5 µm. F, Significantly more vehicle-treated inputs (white bar) are engulfed as compared to forskolin-treated inputs (black bar) within the same dLGN. *P<0.04 by Student’s t-test, n= 5 mice/treatment. All error bars represent s.e.m. See also Figure S3.

