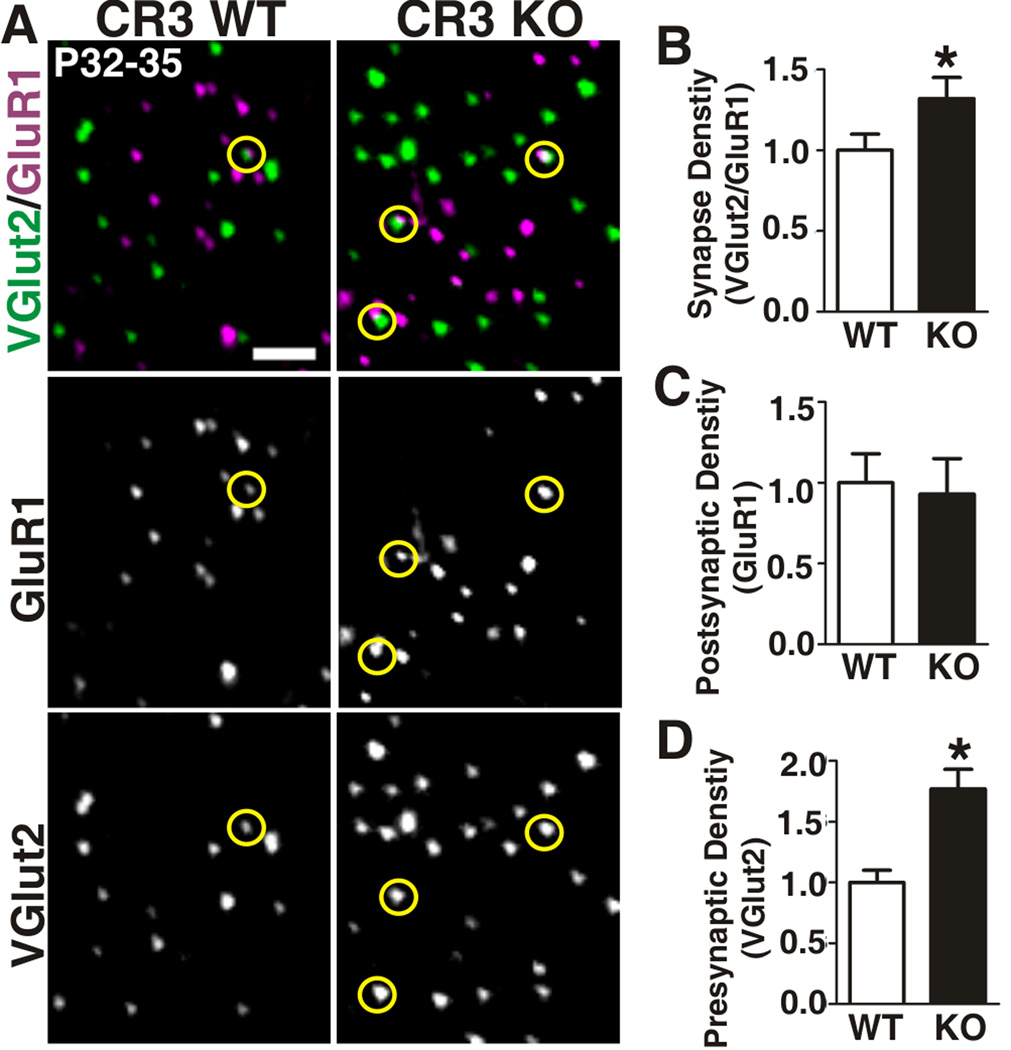
Figure 8. CR3 KO mice have a sustained increase in synapse density.
A, Single plane array tomography images for VGlut2 (green) to label RGC terminals and GluR1 (purple) to label postsynaptic excitatory sites in P32-35 dLGN of CR3 KO (right) and WT littermate controls (left). Yellow circles indicate synapses defined by VGlut2 and GluR1 immunoreactivity. Scale bar = 2 µm. B-D, Quantification of retinogeniculate synapse (B, VGlut2/GluR1-positive), postsynaptic (C, GluR1), and presynaptic/RGC terminal (D, VGlut2) density indicates that there is a statistically significant increase in retinogeniculate synapse density and total RGC terminal density in CR3 KOs as compared to WT littermates. *P<0.03 Man-Whitney U test, n=3 mice/genotype. Error bars represent s.e.m. See also Figure S7.

