
Figure 2.
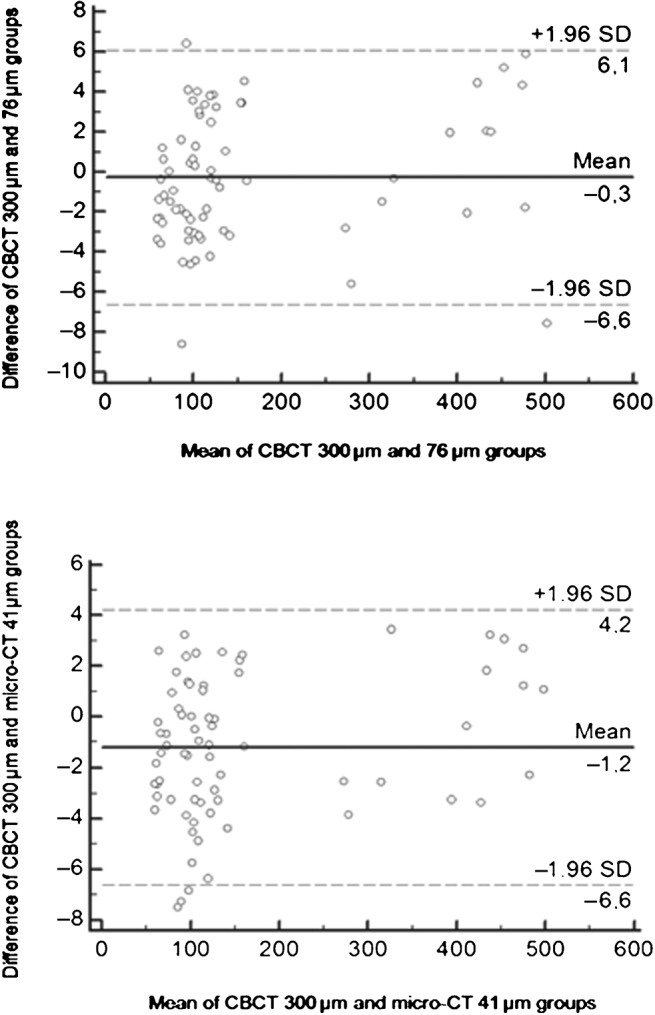
Bland–Altman plot of volumes of teeth between cone beam (CBCT) 300 µm and 76 µm groups (top) and CBCT 300 µm and micro-CT 41 µm groups (bottom). Negative values indicate smaller volumes calculated from the CBCT 300 µm group than with the CBCT 76 µm (top) and micro-CT 41 µm groups (bottom). SD, standard deviation