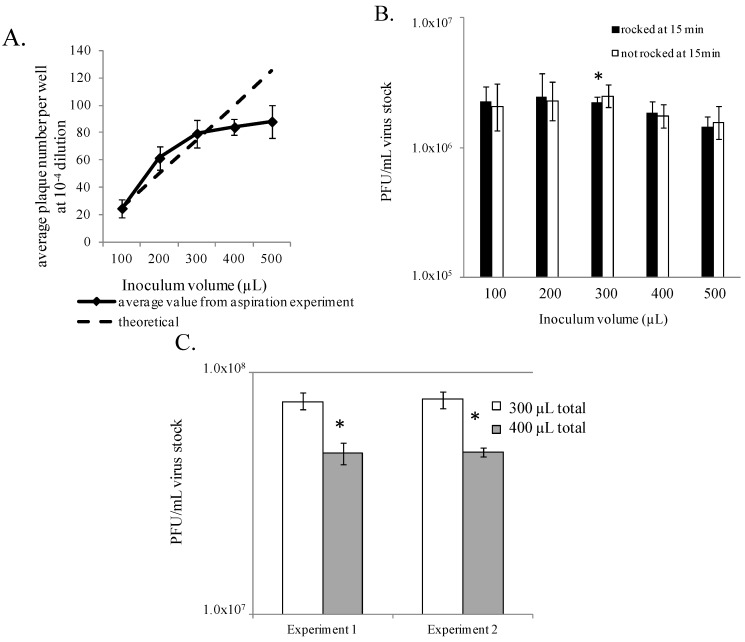
Figure 5.
Evaluation of optimal inoculum volume. (A) EBOV titers may be reduced if the inoculum volume is too large. (B) 300 µL inoculum volume appears optimal for EBOV plaque formation. * indicates a significant difference in value between the 300 µL and the 500 µL conditions, where plates were rocked during incubation. Each bar represents six replicates (two experiments). (C) 300 µL inoculum volume appears optimal for MARV plaque formation. * indicates comparisons between 300 and 400 µL for Experiments 1 and 2, and across Experiments 1 and 2 resulted in p < 0.008. Each bar represents three replicates.

