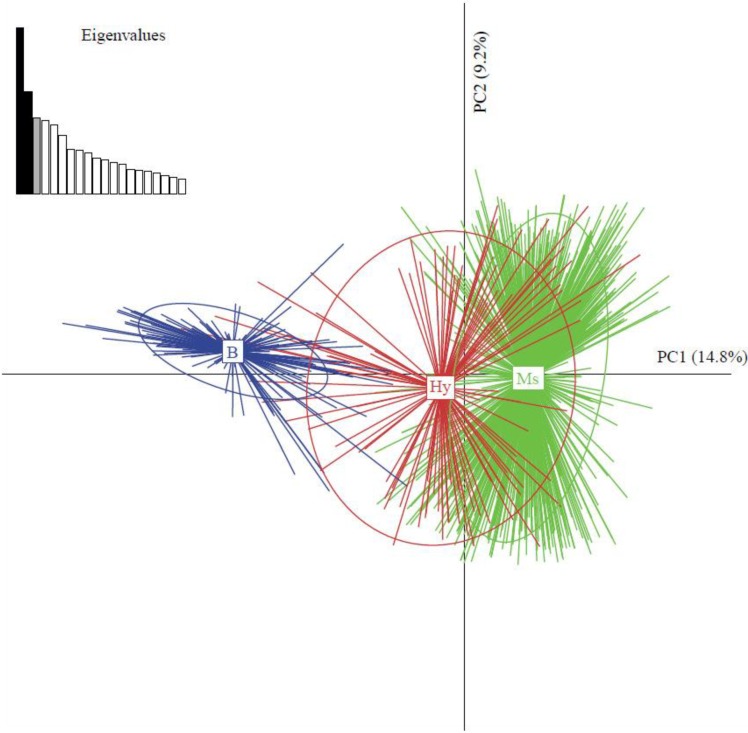
Figure 2.
Multivariate analysis of Bemisia tabaci populations in Reunion Island [72]. First and second components of a principal component analysis of 10-loci microsatellites from B. tabaci females from the three populations MEAM1 (biotype B), Hybrids (Hy) and Indian Ocean (biotype Ms) defined by STRUCTURE analysis. The relative contributions of the two first axes (PC1 and PC2) to the total genetic variation are 14.8% and 9.2% respectively. Eigenvalues corresponding to the represented components are in black. Populations are labeled inside their 95% inertia ellipses.

