Figure 4.
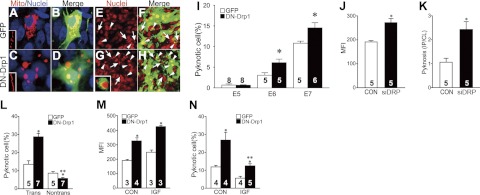
Effect of Drp1 suppression on the PCD of chick MNs. A–D) Following electroporation of EGFP (A, B) or DN-Drp1-IRES-EGFP (C, D) vectors with DsRed-mito plasmids, mitochondrial morphology was examined on E7. Nuclei were counterstained with Hoechst33342 (blue). Insets (A, C): morphology of mitochondria in proximal MN axons. E–H) PCD of MNs in control EGFP (E, F) or DN-Drp1 (G, H) electroporated spinal cord on E7. Nuclei staining (red, E, G) shows increased PCD in DN-Drp1-electroporated subgroup. Merged images (F, H) demonstrate that PCD of GFP-labeled cells in DN-Drp1-electroporated subgroup was increased (arrowheads), whereas PCD of EGFP negative cells was decreased (arrows), compared with the EGFP-electroporated control groups. I) Quantification of neuronal pyknosis on E5–E7. *P < 0.05 vs. EGFP; t test. J) MFI was measured in control or siDRP-transfected MNs. *P < 0.05 vs. vehicle control (CON); t test. K) Ratio of dying cells (pyknosis) in the ipsilateral side and contralateral side (IP/CL) after CON or siDRP electorporation on E5.5. *P < 0.05 vs. CON; t test. L) Quantification of neuronal pyknosis of transfected (trans) vs. nontransfected (nontrans) MNs on E7. *P < 0.05 vs. EGFP; **P < 0.05 vs. trans; t test. M, N) MFI (M) and quantification of pyknosis of transfected cells (N) on E7 with or without IGF1 treatment. *P < 0.05 vs. EGFP; **P < 0.05 vs. trans; t test. Number of samples in each group is shown on each bar.

