Figure 7.
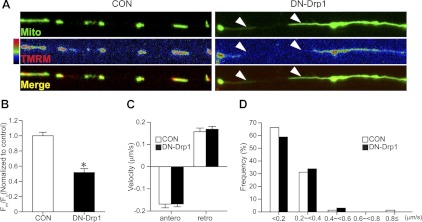
Effects of Drp1 suppression on the mitochondrial membrane potential and axonal transport. A, B) Following electroporation of EGFP-mito alone (CON) or EGFP-mito and DN-Drp1, MNs were cultured in medium containing IGF (200 ng/ml) and GDNF (20 ng/ml). A) TMRM fluorescence was live imaged on DIV2. TMRM fluorescence in GFP-expressing mitochondria in CON and DN-Drp1 groups is shown as a pseudo-color in the middle panels. Morphology of mitochondria is shown in the top panels, and merged images (green, EGFP; red, TMRM fluorescence) are shown in bottom panels. B) Quantification of TMRM fluorescence intensity. Fluorescence intensity was measured from 382 mitochondria on 20 cells for CON, 166 mitochondria on 14 cells for DN-Drp1. *P < 0.05; Student's t test. C, D) Analysis of axonal transport of mitochondria. DsRed-mito with or without DN-Drp1 was electroporated at E3 into chick spinal cord, and spinal MNs were cultured at E5. Velocity and direction of mitochondrial transport in axons were quantified using the ImageJ Manual Tracking plug-in. C) Velocity of anterograde and retrograde mitochondrial transport in CON and DN-Drp1 groups. D) Frequency-fractionation analysis of mitochondrial transport velocity (n=77 from 11 cells for CON, n=65 from 8 cells for DN-Drp1).

