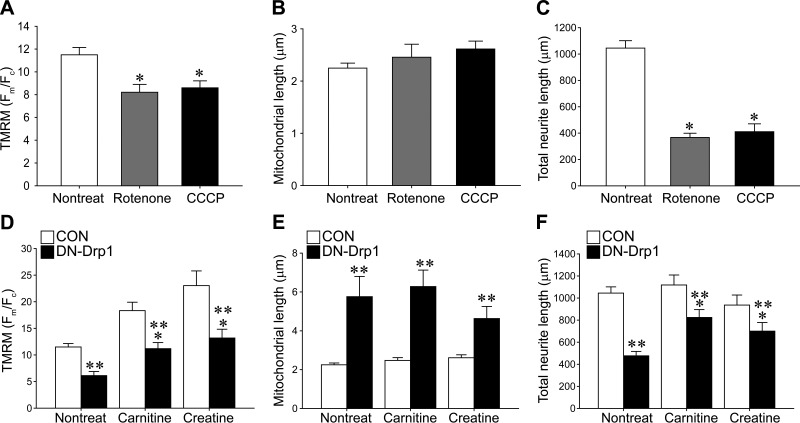
Figure 8.
Effect of chemicals influencing ΔΨm on the axonal growth of MNs. A–C) Membrane potential (A), mitochondrial length (B), and total neurite length (C) were quantified following rotenone or CCCP treatments. D–F) membrane potential (D), mitochondrial length (E), and total neurite length (F) of control or DN-Drp1-transfected MNs were quantified in the presence or absence of carnitine or creatine. At least 30 neurons from 3 independent experiments were analyzed. Data are means ± se. *P < 0.05 vs. nontreated group; 1-way ANOVA in Scheffe's multiple comparisons for post hoc comparisons; **P < 0.05 vs. control group; t test.

