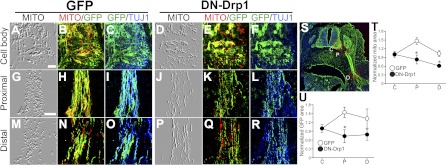
Figure 9.
Effect of Drp1 suppression on mitochondrial distribution and axonal development. A–R) EGFP (A–C, G–I, M–O) or DN-Drp1-IRES-EGFP (DN-Drp1; D–F, J–L, P–R) vectors were coelectroporated with dsRed-mito vector, and the EGFP (green), DsRed-mito (red), and TUJ1 (blue) signals were examined at the cell body (A–F) or at proximal (G–L) and distal (M–R) levels of axonal processes. Left panels show embossed mitochondrial images (MITO) for better visualization of the mitochondria (A, D, G, J, M, P); adjacent panels show double-labeled images of MITO/EGFP (B, E, H, K, N, Q) and EGFP/TUJ1 (C, F, I, L, O, R). Scale bars = 20 μm (A, for A-F; G, for G-R). S) Red dotted boxes indicate location of MN cell body (C), and proximal (P), or distal (D) axons. T) Quantification of the mitochondrial distribution in cell body (C) and proximal (P) and distal (D) axons in EGFP (open circles) or DN-Drp1 (solid circles) electroporated groups. For measurement of normalized mitochondrial area, mito and EGFP double-labeled area was divided by EGFP area in each image, and scores were normalized to mean values from cell bodies. *P < 0.05; n = 5. U) Quantification of axonal development in EGFP (open circles) or DN-Drp1 (solid circles) electroporated groups. For measurement of normalized EGFP area, EGFP-labeled area was divided by TUJ1-labeled area in each image, and scores were normalized to mean values from cell bodies. *P < 0.05; n = 5.

