
Figure 1.
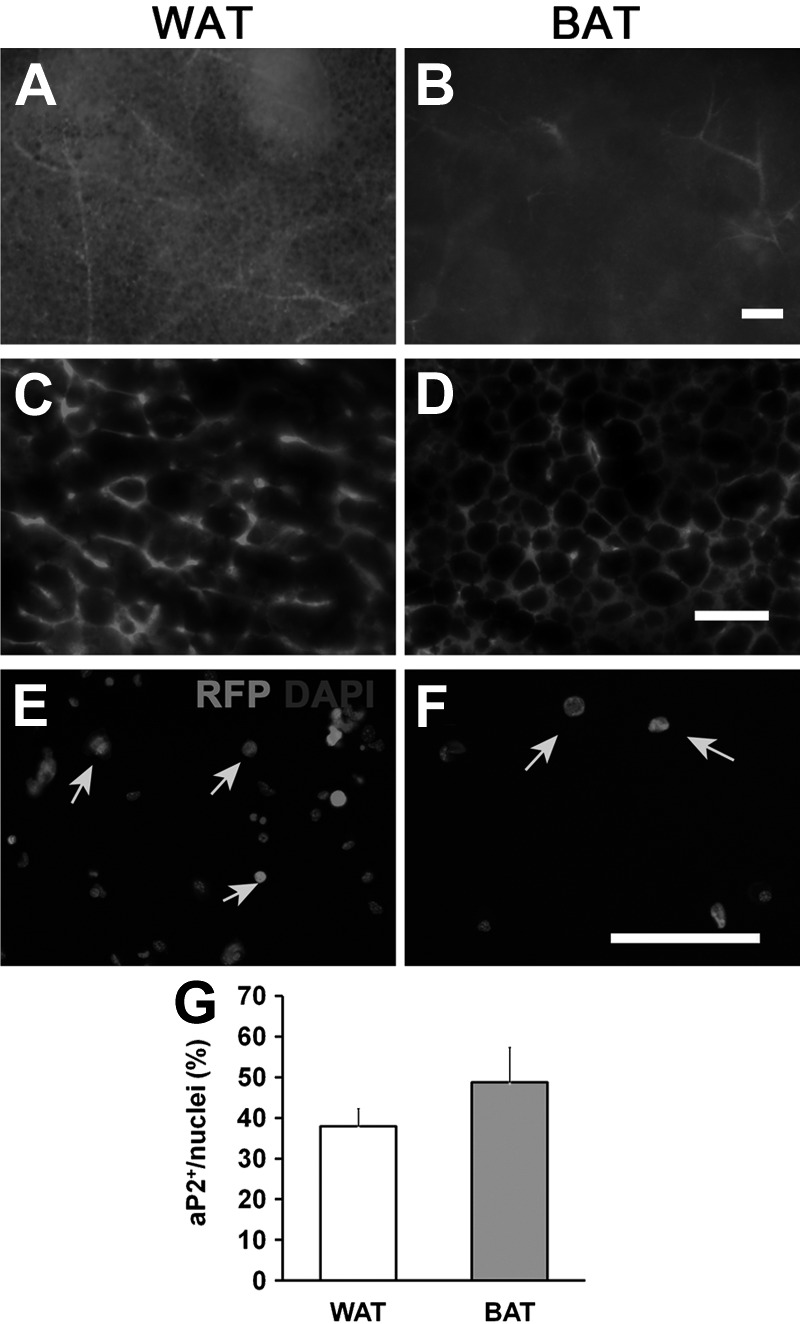
aP2-lineage tracing in adipose tissues and SVF cells. A, B) Whole-mount fresh tissues from WAT (A) and BAT (B) of aP2-Cre/Rosa26-tdTomato mice were used. In this model, all aP2-lineage cells were marked by tdTomato (RFP) expression. Note the intense RFP signal in vascular structures. C, D) Sections of WAT (C) and BAT (D) tissues showing high levels of RFP expression in many cells. E, F) RFP expresses in WAT (E) and BAT (F) SVF cells. Red, RFP; blue, 4′,6-diamidino-2-phenylindole (DAPI). G) Percentage of RFP+ cells in SVFs from WAT and BAT. Arrows indicate RFP positive cells. Error bars = se; n = 5. Scale bars = 200 μm (A, B); 100 μm (C–F).