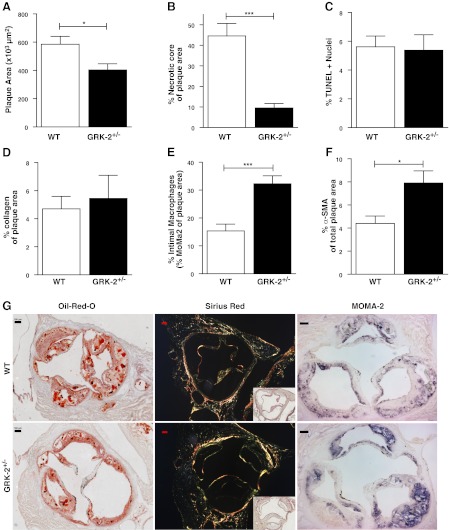
Figure 1.
Atherosclerotic plaque development is attenuated in GRK2+/− chimeras. A, B) Plaque area (A) and necrotic core size (B) were determined based on Oil Red O staining. C) Relative number of apoptotic cells was determined by TUNEL staining. D) Collagen content was measured by analysis of Sirius Red staining under polarized light. E) Macrophage content was measured in sections stained for the monocyte/macrophage marker MOMA-2. F) Smooth muscle cell content was measured by staining against α-smooth muscle cell actin (α-SMA). G) Representative pictures of Oil Red O, Sirius Red (polarized light; inset: bright field image), and MOMA-2 staining are shown for WT and GRK2+/− chimeras. Scale bars = 100 μm. Open bars, WT; solid bars, GRK2+/− chimeras. *P < 0.05, ***P < 0.001.

