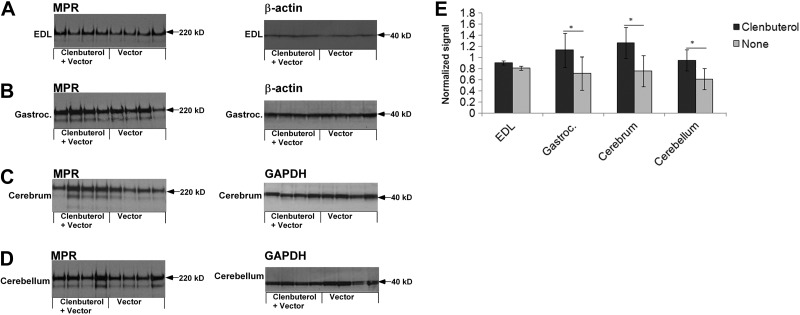
Figure 2.
Western blot analysis of CI-MPR expression in skeletal muscle and brain. Western blot detection of CI-MPR and control proteins, β-actin or glyceraldehydes-3-phosphate dehydrogenase (GAPDH) in the tissues of GAA-KO mice is shown, with molecular weights indicated. Each lane represents an individual mouse. Equivalent quantities of tissue homogenate were loaded for each mouse. A) EDL. B) Gastrocnemius. C) Cerebrum. D) Cerebellum. E) Signal for CI-MPR, as quantified by densitometry of Western blots. Means ± sd are shown. Statistically significant alterations associated with clenbuterol treatment are indicated. *P < 0.05.

