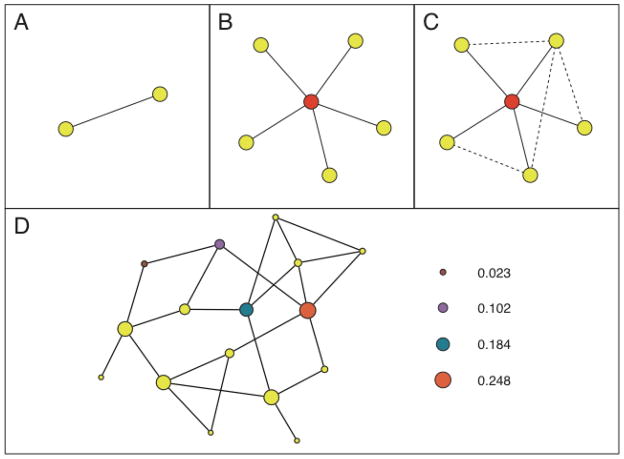
Figure 2.
This schematic illustrates some fundamental social networks concepts. (A) Nodes and ties are the elementary building blocks of networks. A tie connecting two nodes (physicians) indicates that the two physicians share one or more patients. (B) The degree of a node quantifies the number of connections a given node has. For example, the red node at the center of the figure has a degree of five, i.e. the physician shares patients with five other physicians. In our work, we present adjusted degree (degree divided by the number of Medicare patients cared for by each physician). (C) The clustering coefficient is a metric that quantifies the extent to which the network neighbors of a given node are directly connected to one another. More specifically, the clustering coefficient of the physician at the center of the figure (red node) is given by the number of ties that exist among his or her colleagues (the dashed four ties) divided by the number of ties that could exist between them (in this case 10), yielding a value of 4/10 or 0.4. This number can also be interpreted as the probability that any two randomly chosen network neighbors of the individual at the center are directly connected to one another. (D) Betweenness centrality quantifies the structural centrality of a node in the network. The betweenness centrality of a node is proportional to the number of times the node lies on shortest paths in the network, where one considers all shortest paths, i.e. shortest paths from every node in the network to every other node in the network. In the schematic, the size of a node is proportional to its betweenness centrality score, and the betweenness centrality scores are shown for four nodes in increasing order of centrality. In our work, we present relative PCP or specialist centrality, where we divide the mean PCP or specialist centrality for all physicians in the network by the mean centrality of all other physicians in the network.

