Figure 3.
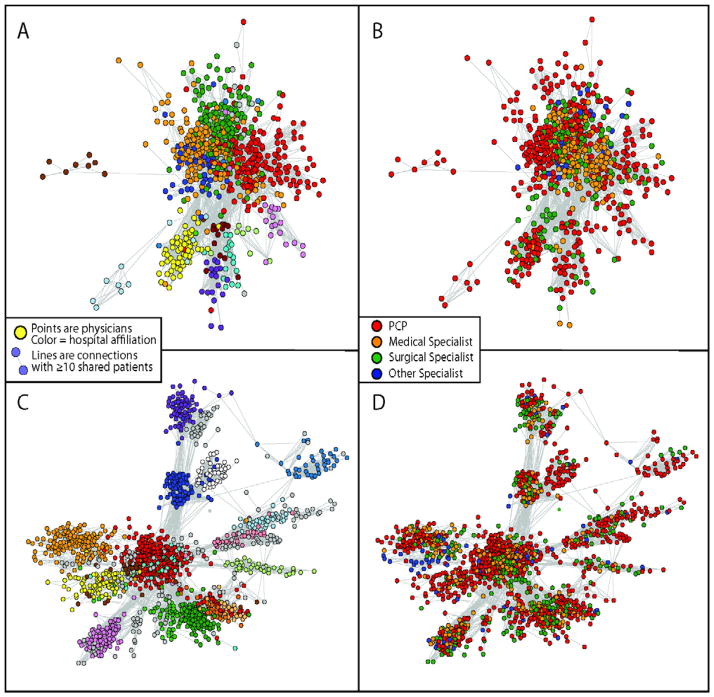
Depictions of two networks: Albuquerque, NM (panels A and B, ~1000 physicians) and Minneapolis/St. Paul, MN (Panels C and D, ~1700 physicians). On the left (panels A and C), hospital affiliations are coded (each hospital is represented by a different color and on the right (panels B and D) specialty is coded.
Depictions of two networks: Albuquerque, NM (panels A and B, ~1000 physicians) and Minneapolis/St. Paul, MN (Panels C and D, ~1700 physicians) using “spring embedder” methods, which position objects with strong connections (i.e., physicians with more shared patients) in closer physical proximity. On the left (panels A and C), hospital affiliations are coded (each hospital is represented by a different color and on the right (panels B and D) specialty is coded.

