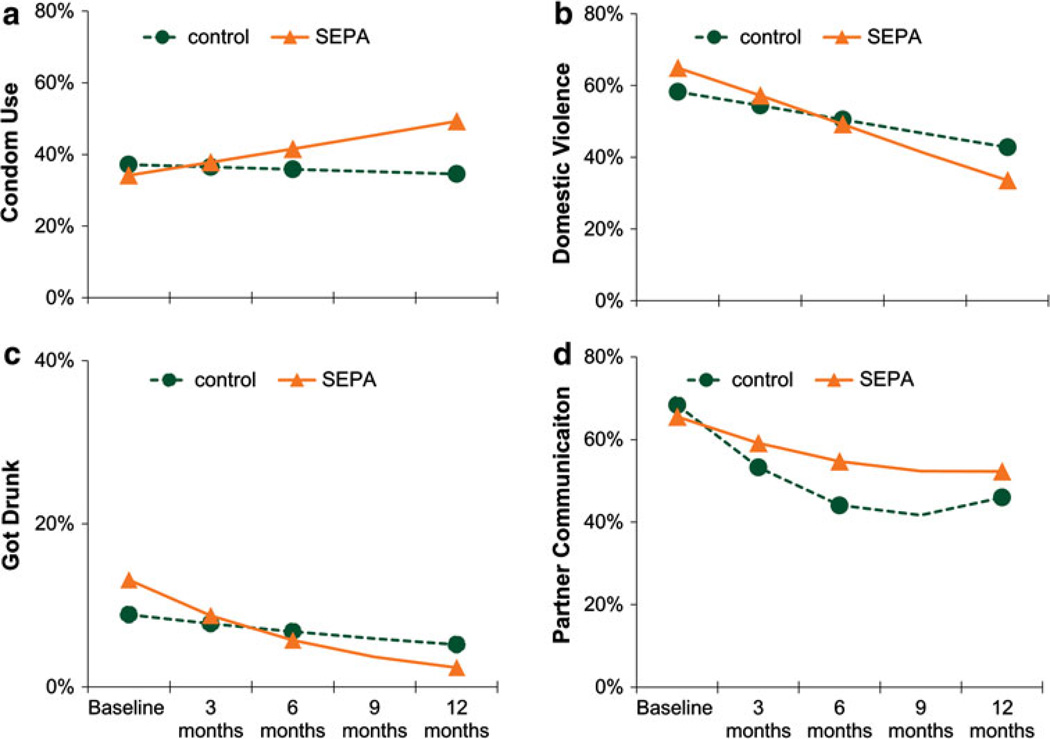
Fig. 3.
Estimated trajectories over 1 year of a condom use, b domestic violence, c got drunk, and d partner communication for women in the control (circles, dashed lines) and SEPA (triangles, solid lines) conditions. The y-axis for got drunk is on a different scale than the other outcomes due to the low number of women who got drunk in this sample

